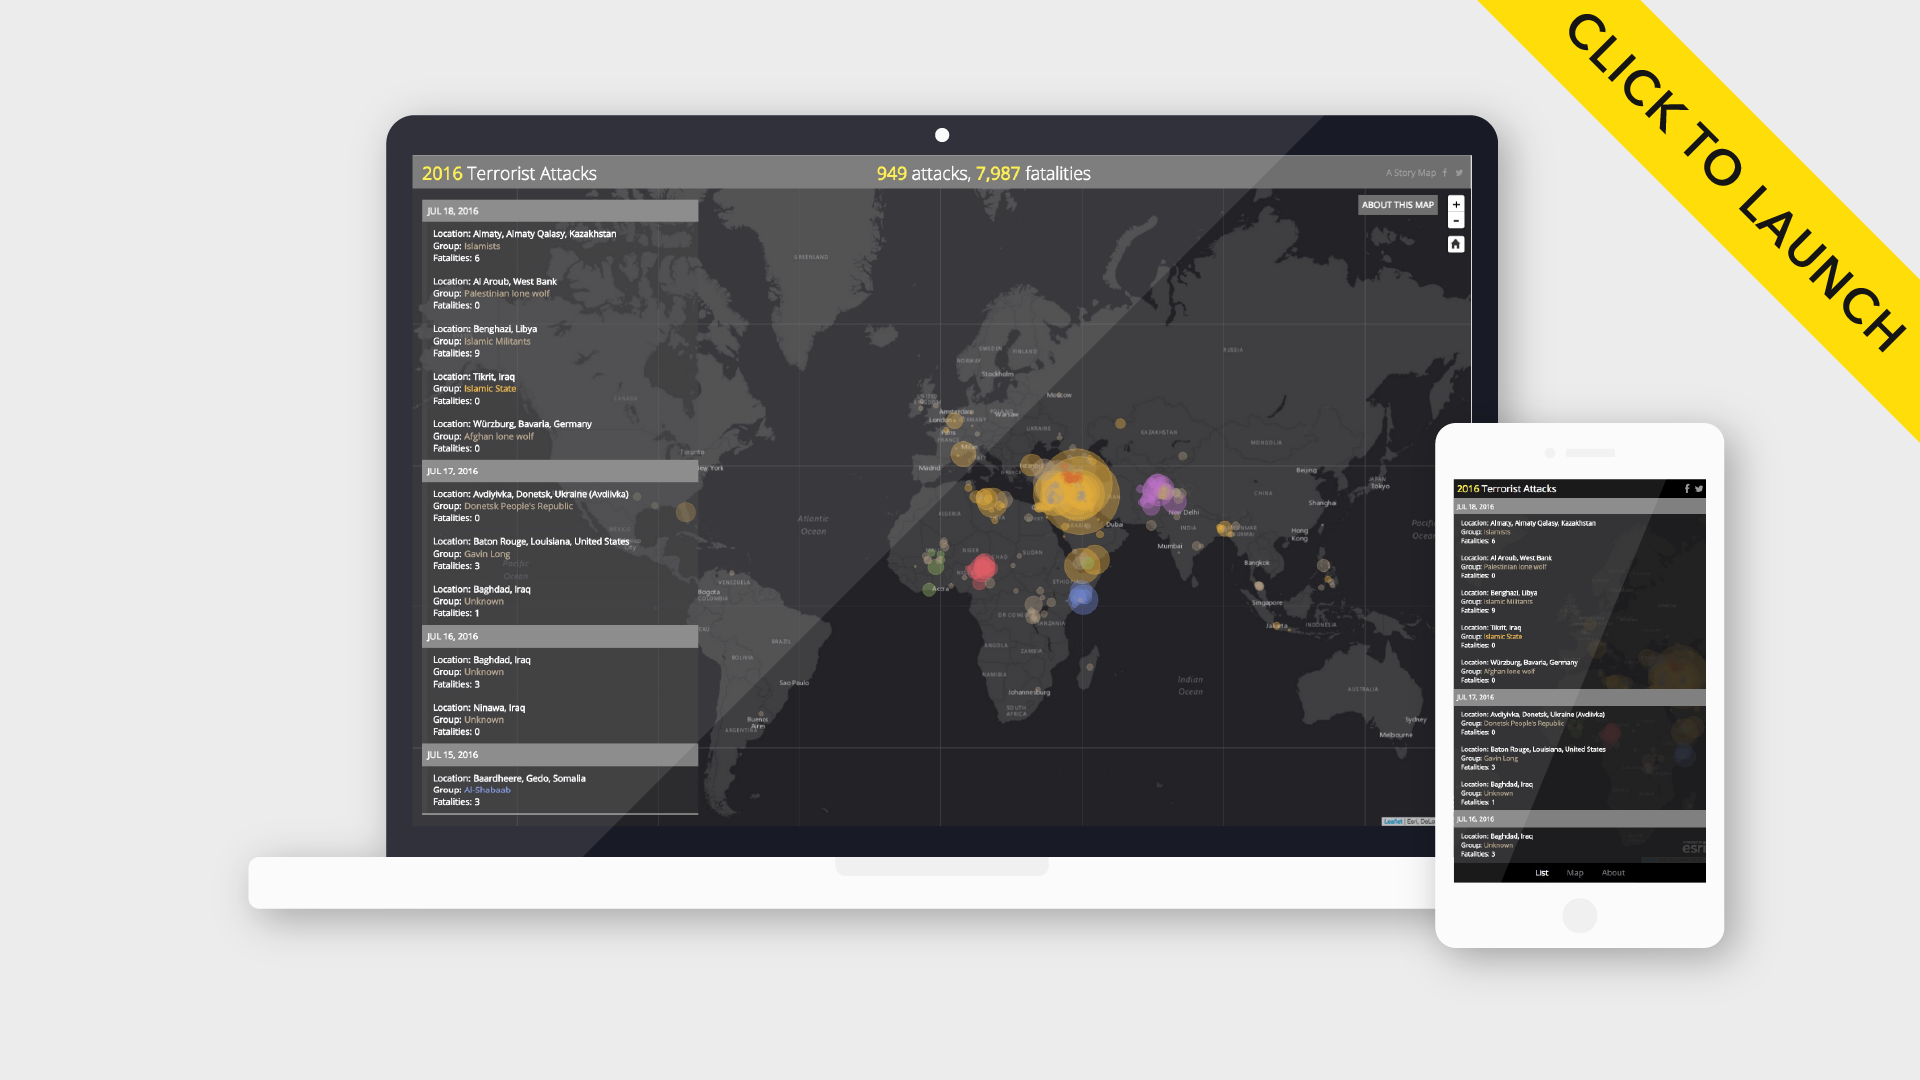
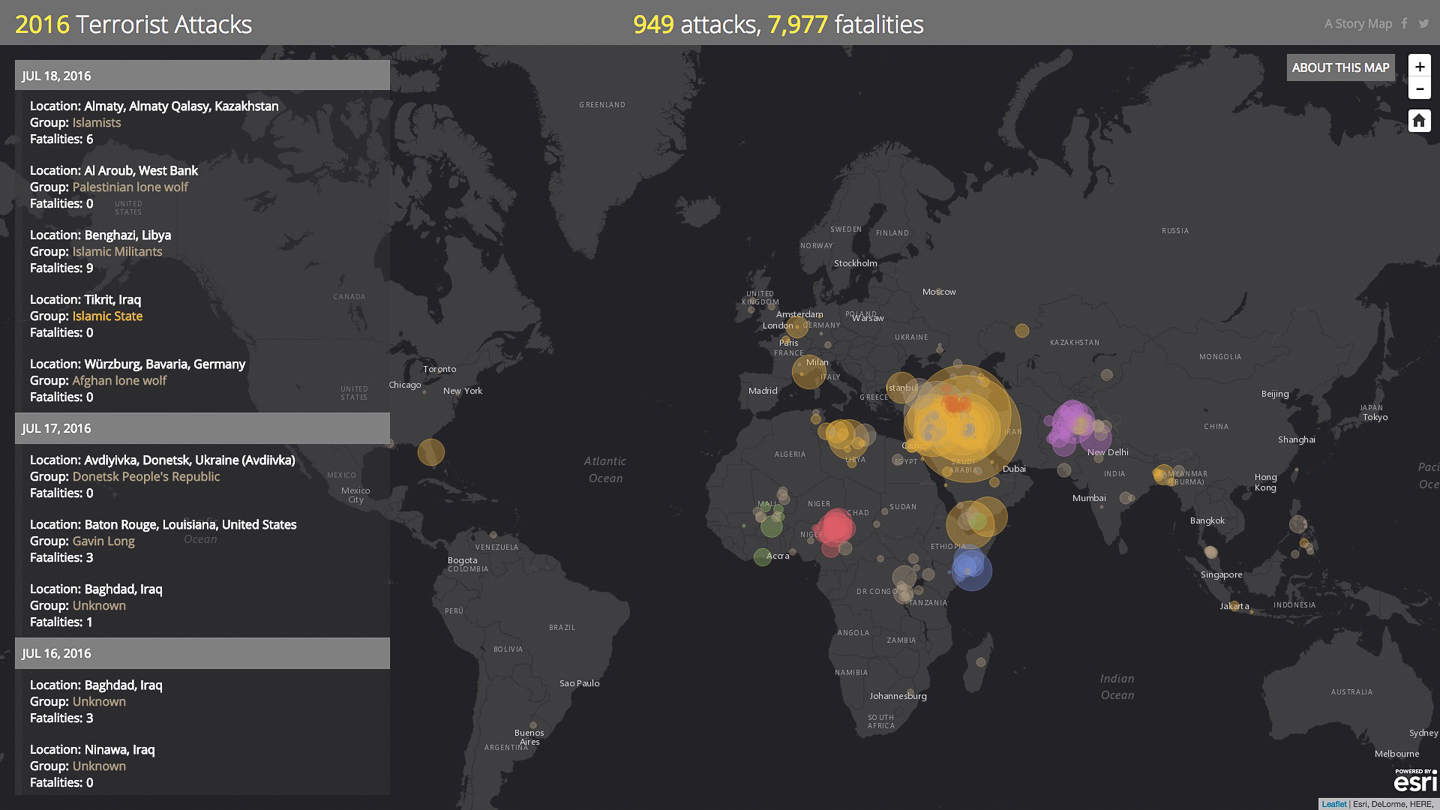
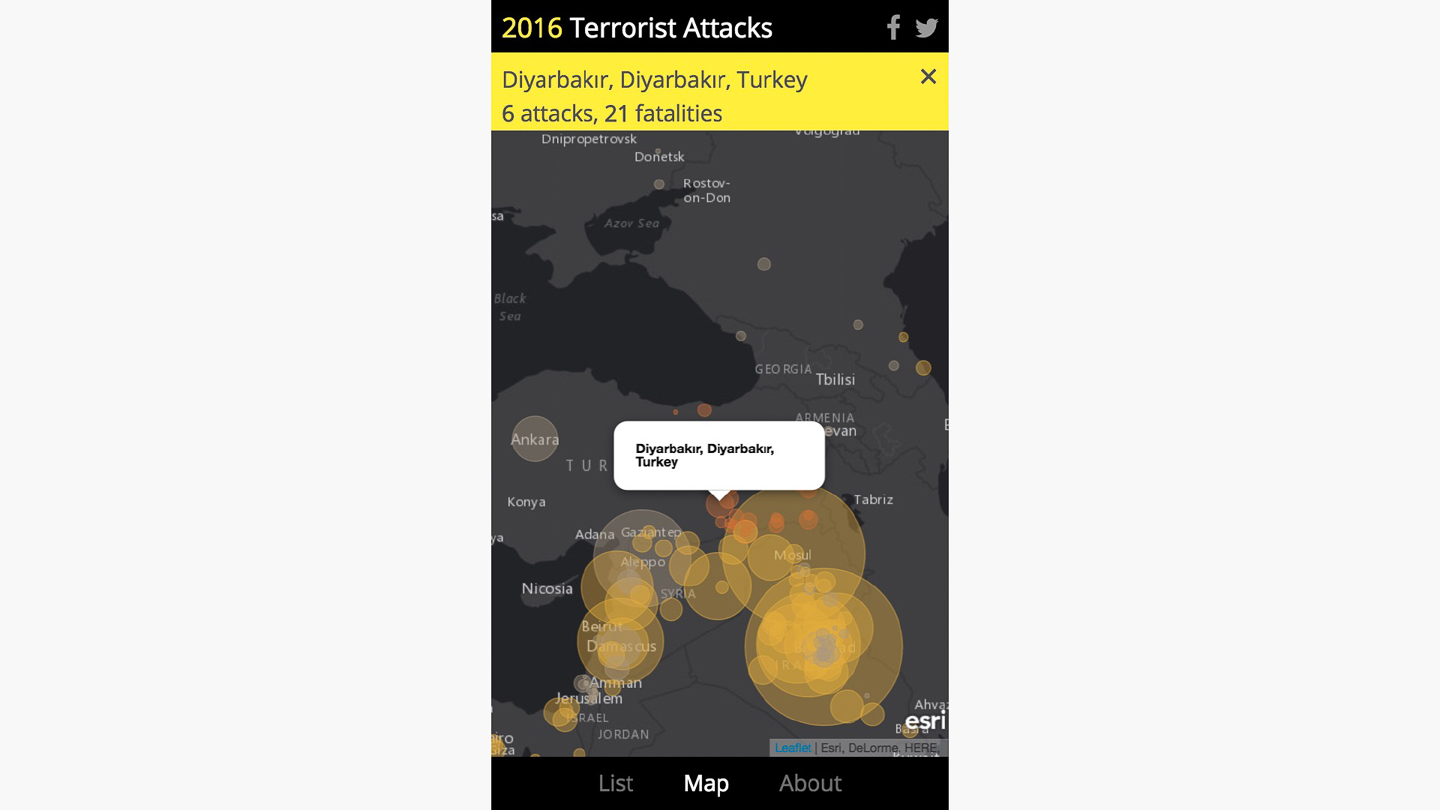
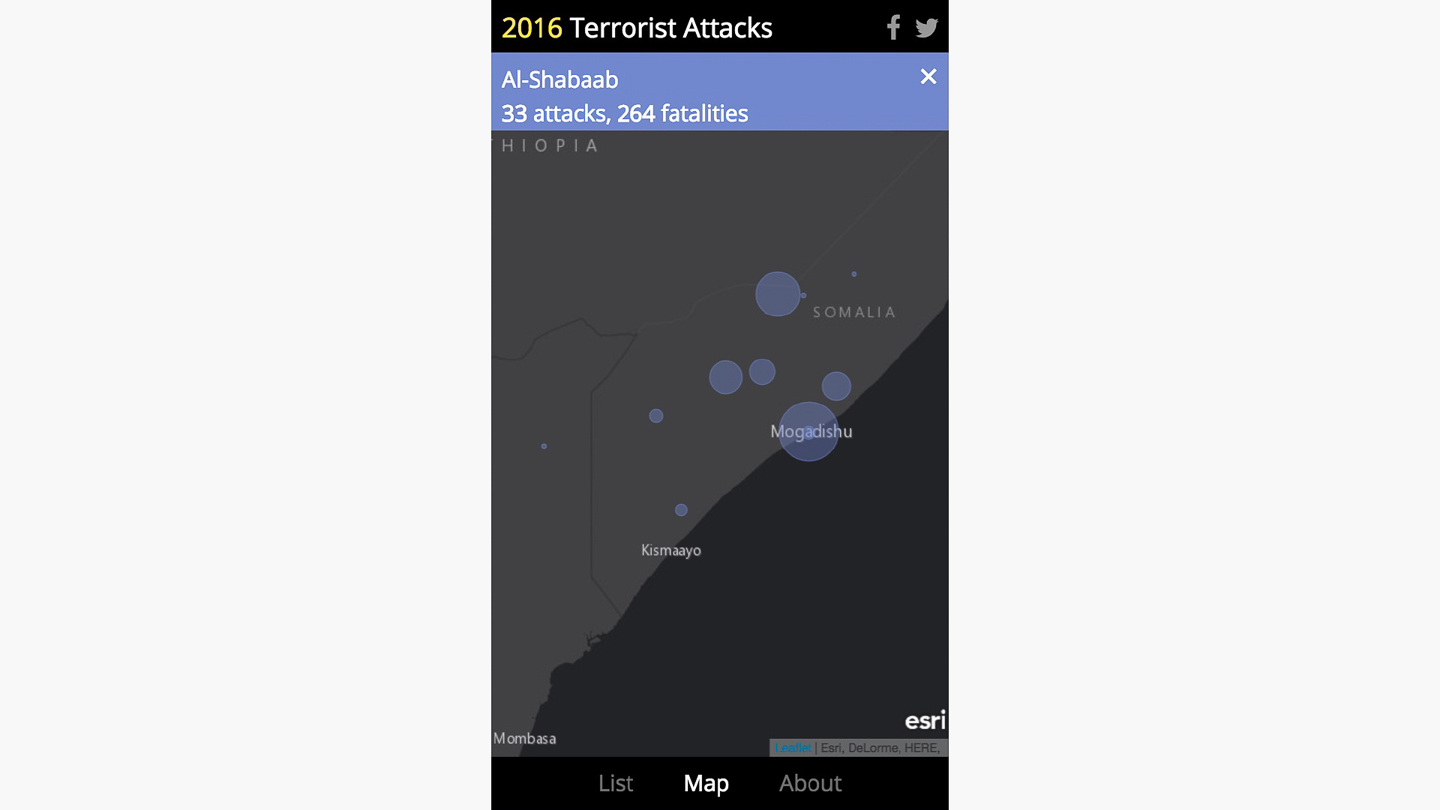
This custom Story Map uses crowdsourced data from Wikipedia, updated every hour, to present a chronology of terrorist attacks around the globe. A collaboration between the Story Maps team and the conflict experts at PeaceTech Lab, the map illustrates the global reach of terrorism in the 21st century, while also drawing attention to the regional domains of several different terrorist organizations. Spoiler alert: the map is kind of a downer.
HOW TO USE THE MAP
– By default, attacks are aggregated by city or location, and the map symbol size corresponds to the total number of fatalities at that location.
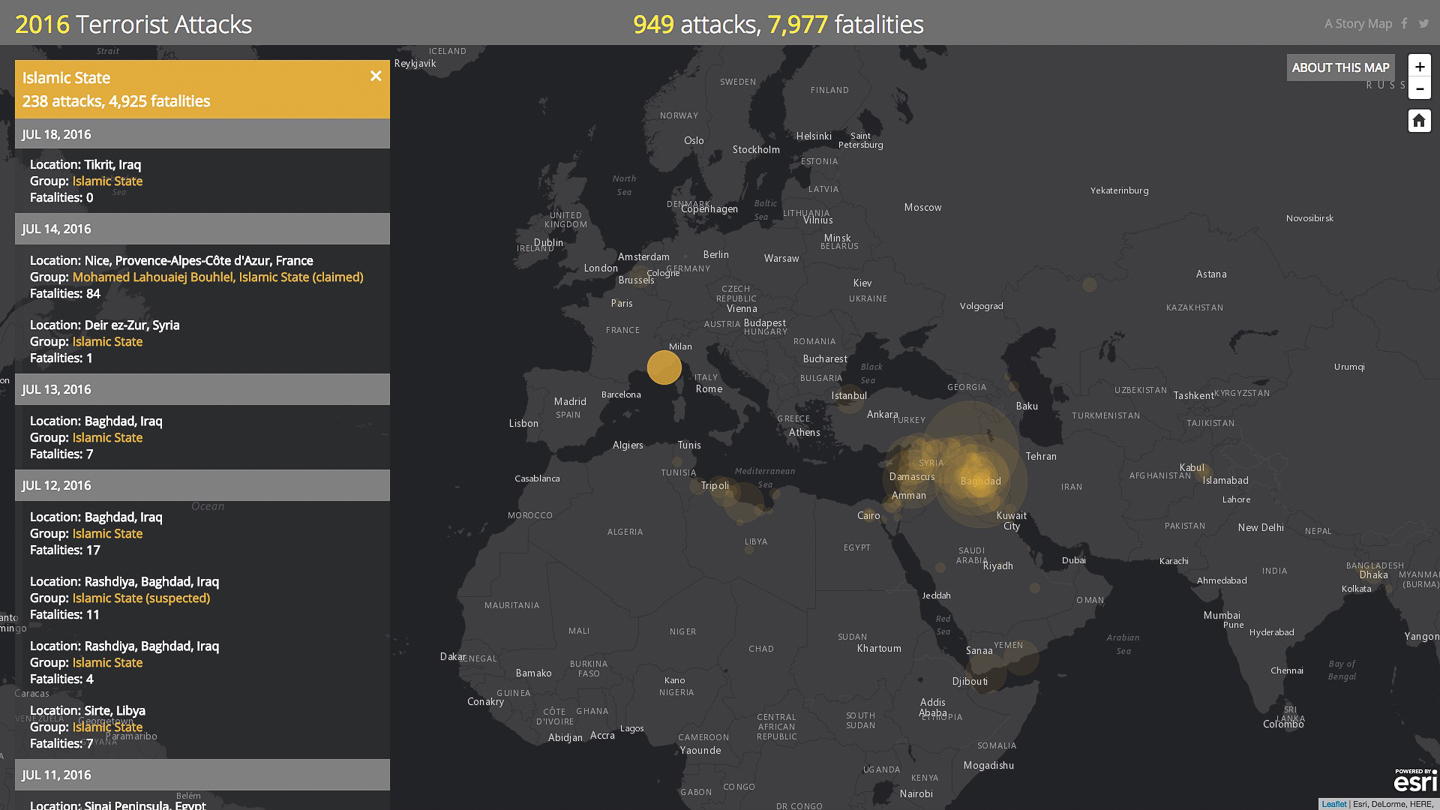
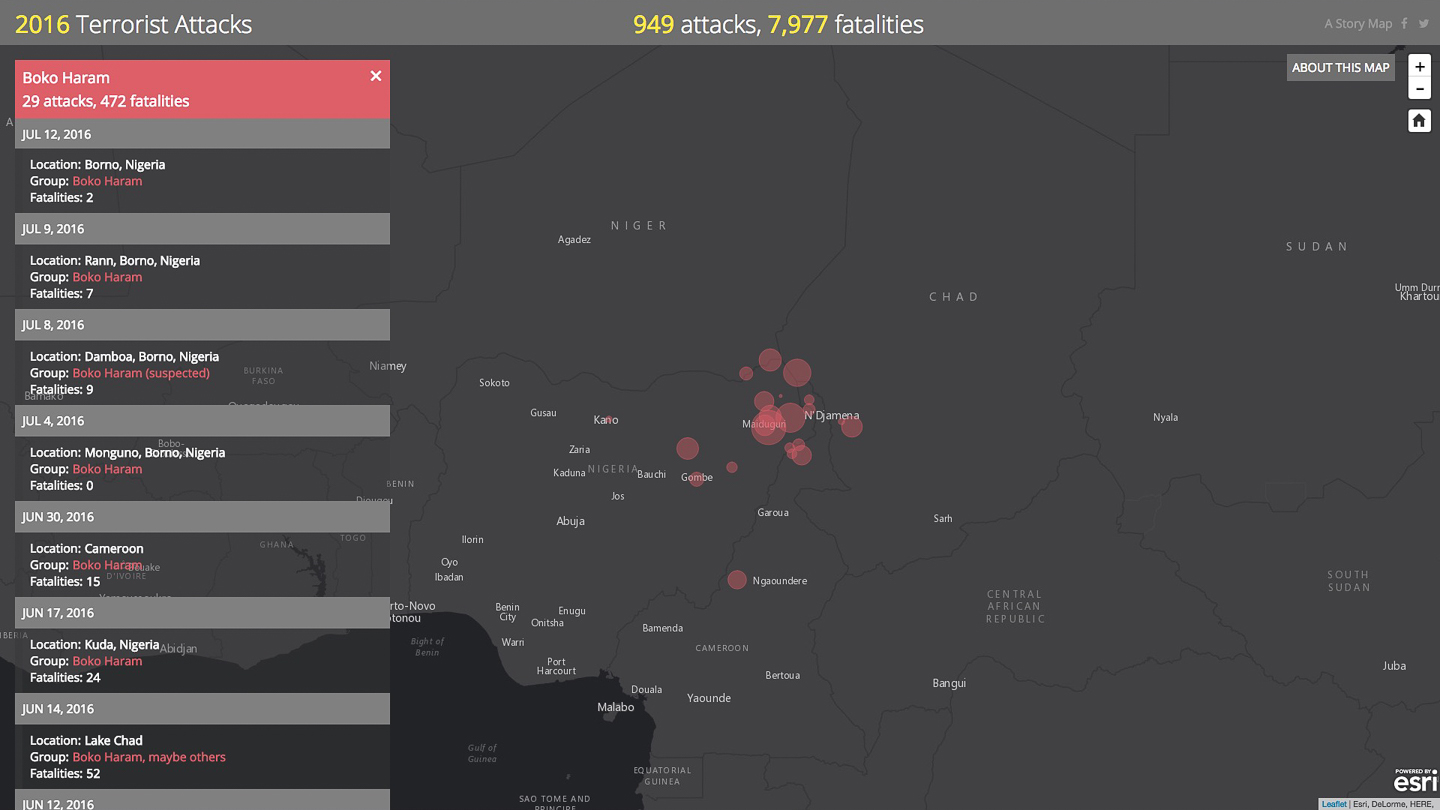
– To show the details of a specific attack, select that attack in the info panel. When an attack is selected, the map symbol size corresponds to the number of fatalities in that particular attack, and is colored according to the perpetrator of that attack.
– To filter the list by location, select a location directly on the map, or select the location of a currently highlighted attack in the info panel.
– To filter the list by group, select the group name of a currently highlighted attack in the info panel.
– To learn more about the different terrorist groups and the map itself, select the “About” button.
HOW IT WORKS
A single Node.js script, set to run automatically on an hourly timer, does the following:
– Scrapes the HTML tables on the source Wikipedia pages (one for each month of the year)
– Merges the data into a single Javascript array
– Cleans and processes the data (e.g., discards unused fields, dumps bracketed footnote references, forces strings into integers, etc.)
– Iterates through the features and compares their listed locations to a table of known locations
– Geocodes any new locations
– Exports the updated array as a new CSV
— Pushes the CSV to the gh-pages branch of a Github repo (since Github’s raw URLs aren’t really designed to serve content)
The app itself then reads this CSV directly from Github. Ta-da!
WHY IT USES WIKIPEDIA DATA
Before you get your panties in a twist over the questionable credibility of Wikipedia data, consider the following facts about the source material:
– It’s updated often: the pages driving this story have been revised thousands of times since the beginning of 2016. As a result, the quality of the data on this map is constantly improving. Conversely, most authoritative terrorism databases are only published annually.
– It’s easy to read: all of the events reside in simple HTML tables, and so accessing and cleaning the data is relatively straightforward.
– It’s detailed: each record includes several useful attributes, which provide valuable information and can be used to filter the data categorically, numerically, and chronologically. Some of the other data sources we considered only provided the date of the attack, the name of the perpetrator, the location, and the number of casualties.
– It’s comprehensive: the Wikipedia pages contain many more individual events than other data sources. It was important for us to show terrorist attacks across the globe, not just the high-profile attacks covered by Western media.
– It’s free. Commercial licenses for this kind of data are outrageously expensive.
Of course, there’s a very real chance that the map will contain spurious or objectionable data, but so far we’ve found that the content moderators have done an admirable job of policing the submissions, often rejecting uncited attacks and attacks of questionable relevance.
COMPROMISES
My initial designs for this app included a draggable time filter and histogram, a social media “chatter” monitor (essentially just a line chart measuring the volume of relevant social media activity), more robust filtering options (including an auto-completing group/location search bar), cleaner integration with Wikipedia for on-the-go edits and attack submissions, and a streamlined UI, among other capabilities. However, we decided to slash all of these features in order to release the map while the topic was fresh and relevant. (I’d dispute this justification, and argue that terrorism isn’t going anywhere anytime soon, sadly, but these aren’t my decisions to make.) Frankly, I think we could’ve done a whole lot better with the design; the interface is kind of clunky and unintuitive, and the type treatment and cartography are uninspired. But on the balance, I think it’s still an interesting, effective tool.
The time slider and histogram/proportional symbol chart were included in the app from the outset, and so it pained me greatly to drop them at the last minute (especially since we’ve since received several viewer requests to include a time filter). In my opinion, these features provide critical temporal context, and the overall usefulness of the map suffers from their absence. That said, I’m hopeful that we’ll be able to implement some of these these missing features by the end of the year. If the map proves to be popular, we’ll do another one for 2017 (publishing it in January this time, instead of July).

