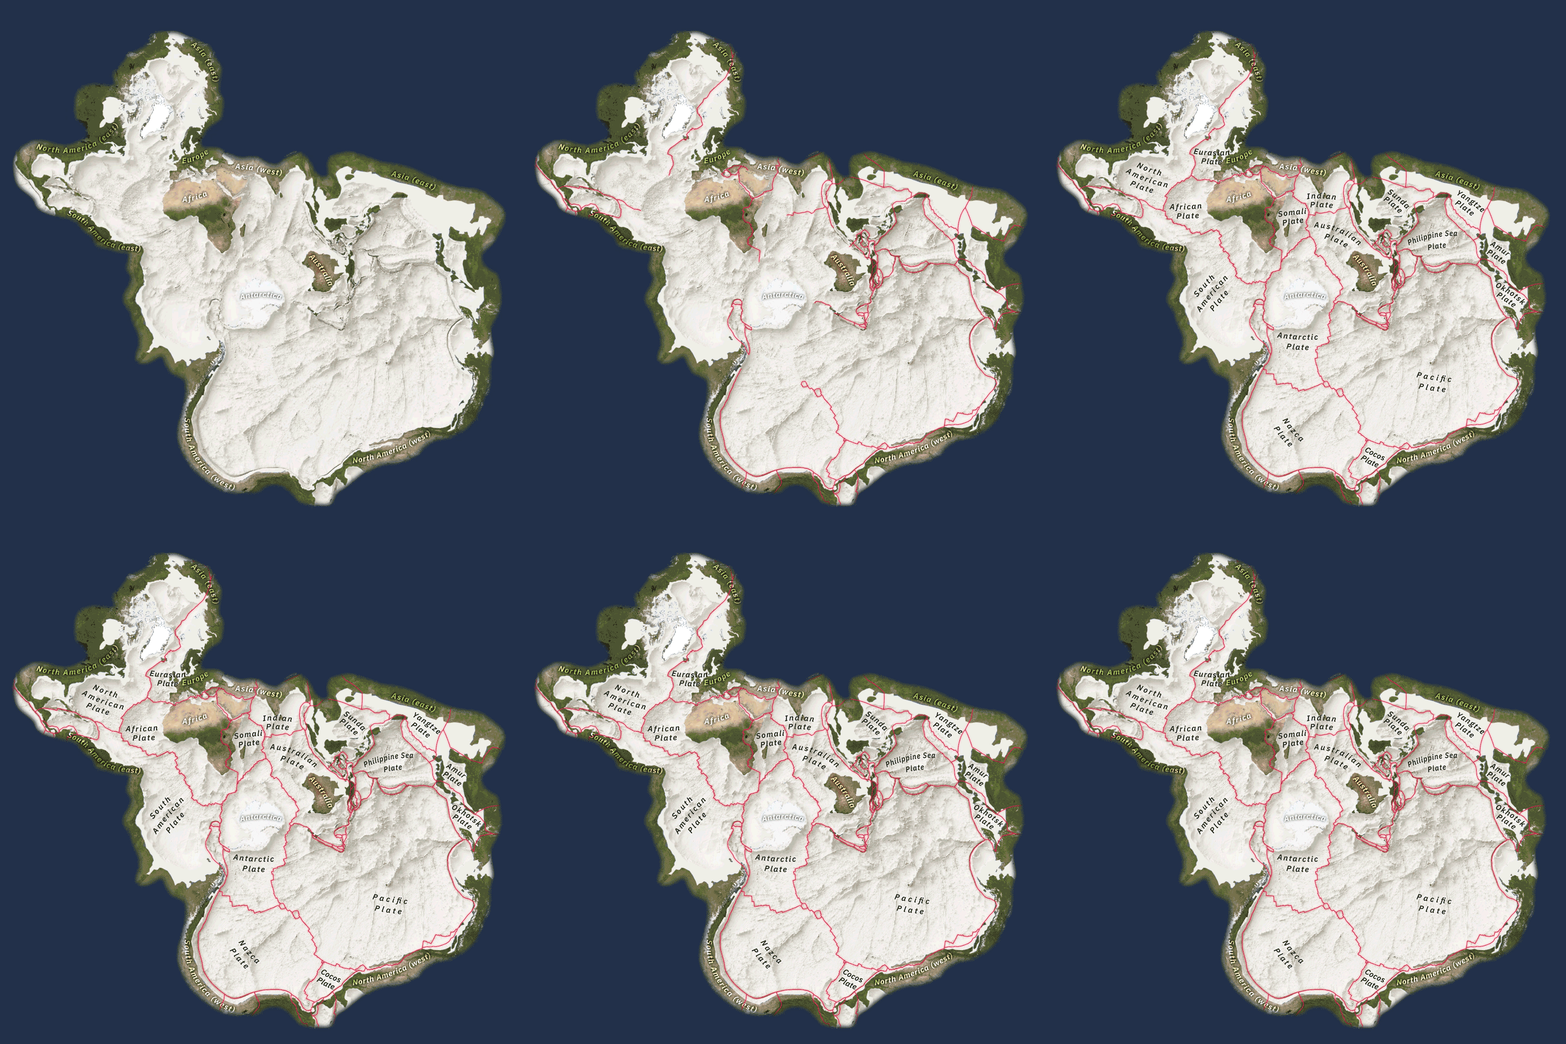
I researched and designed a series of animated maps for this story about seabed mapping. (My talented colleague Ross Donihue also included them in a short explainer video, available here.)
I typically don’t have many opportunities to create animated maps, and I really enjoyed exploring some new workflows and tools to produce these. I’ve included a couple of my favorites below. The animations themselves are intended more as dynamic transitions than meaningful representations of data; you can see what I mean (and view the whole series) in the story.


