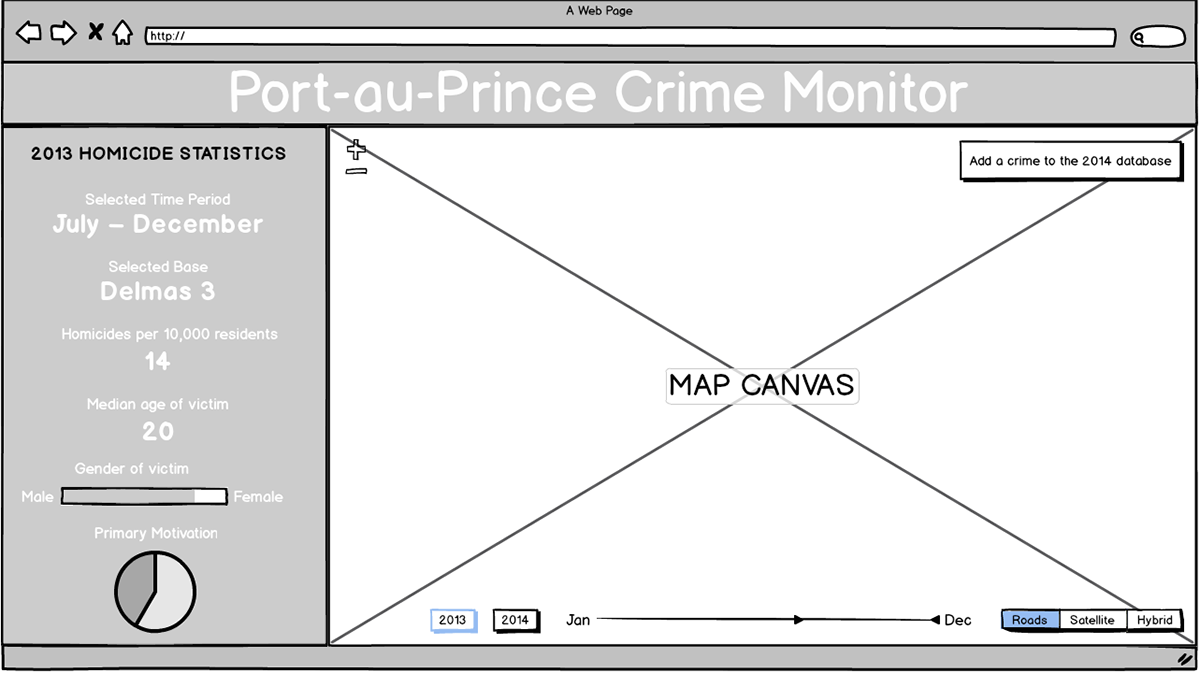
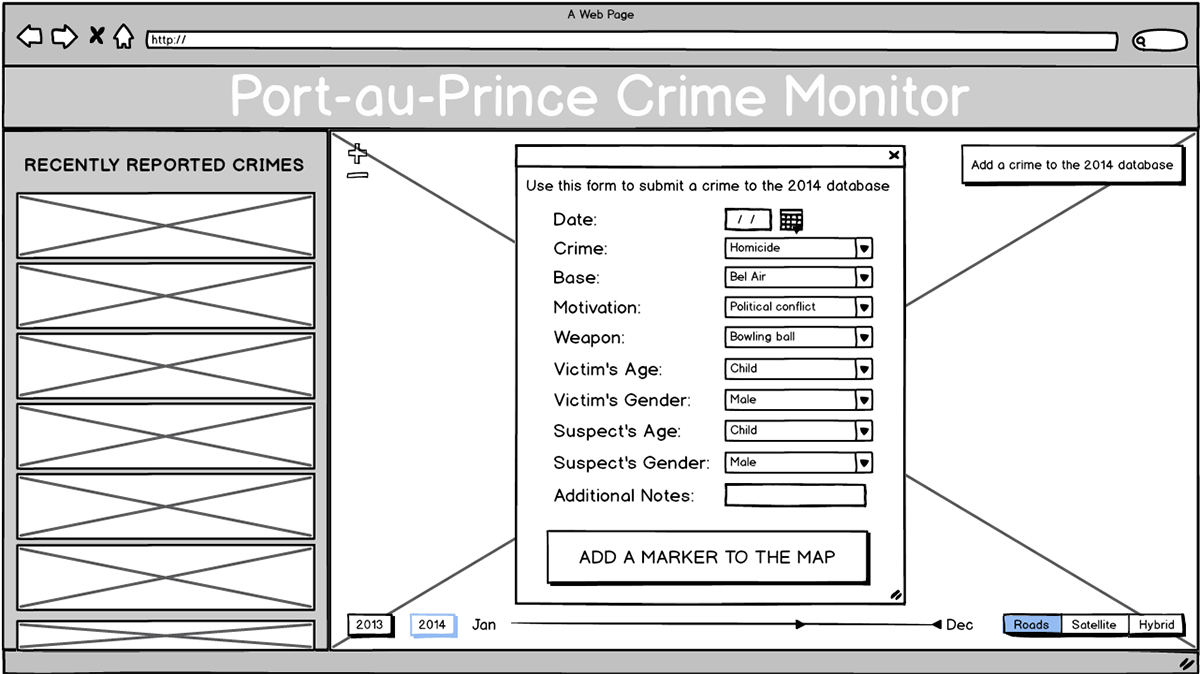
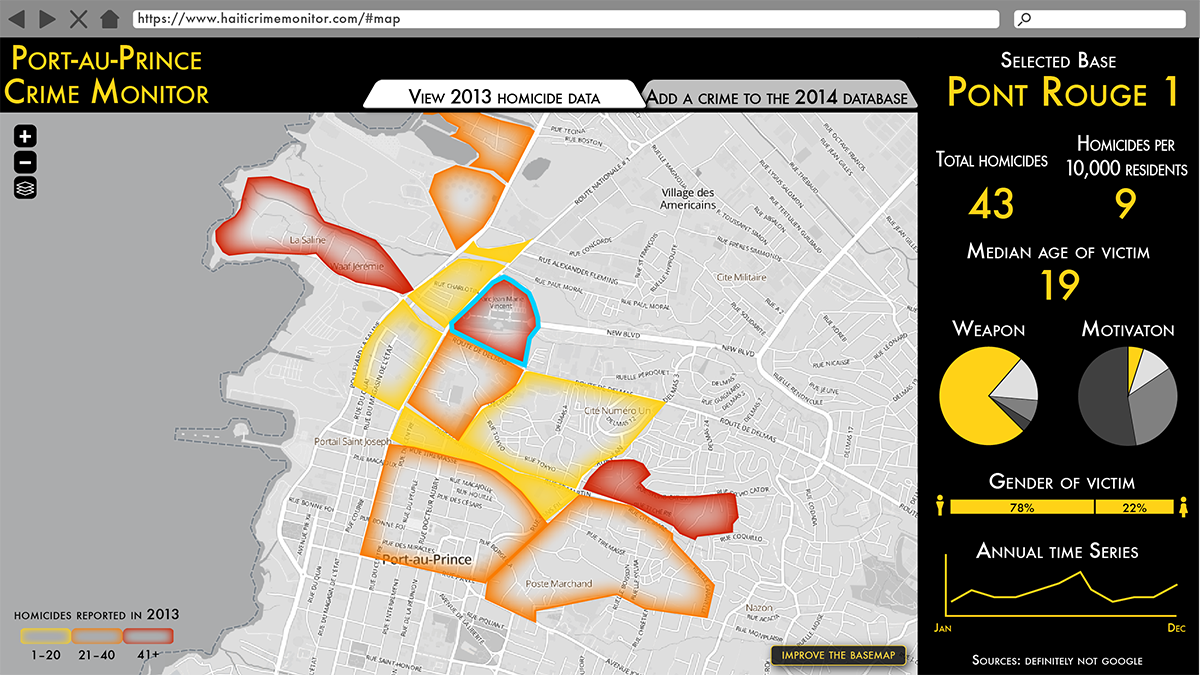
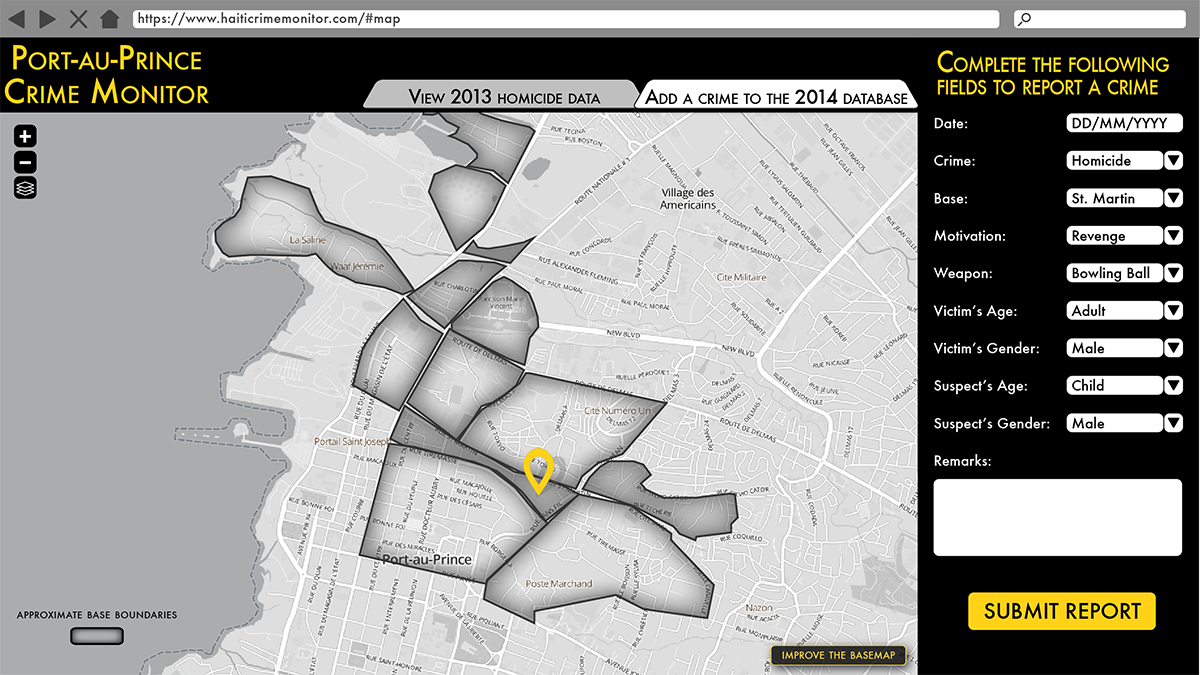
I recently had the privilege of working on the UI design for a cartographic microsite commissioned by Viva Rio, a Brazil-based non-profit. The site serves two primary purposes: to visualize 2013 homicide data from the Haitian capital Port-au-Prince, and to enable users to report crimes to a secure central database. Both functions rely on a simple cartographic interface for navigation. While I’m only tangentially involved in the development process, I’ll post a link to the site once it’s complete.
Disclaimer: the pie charts weren’t my idea.


