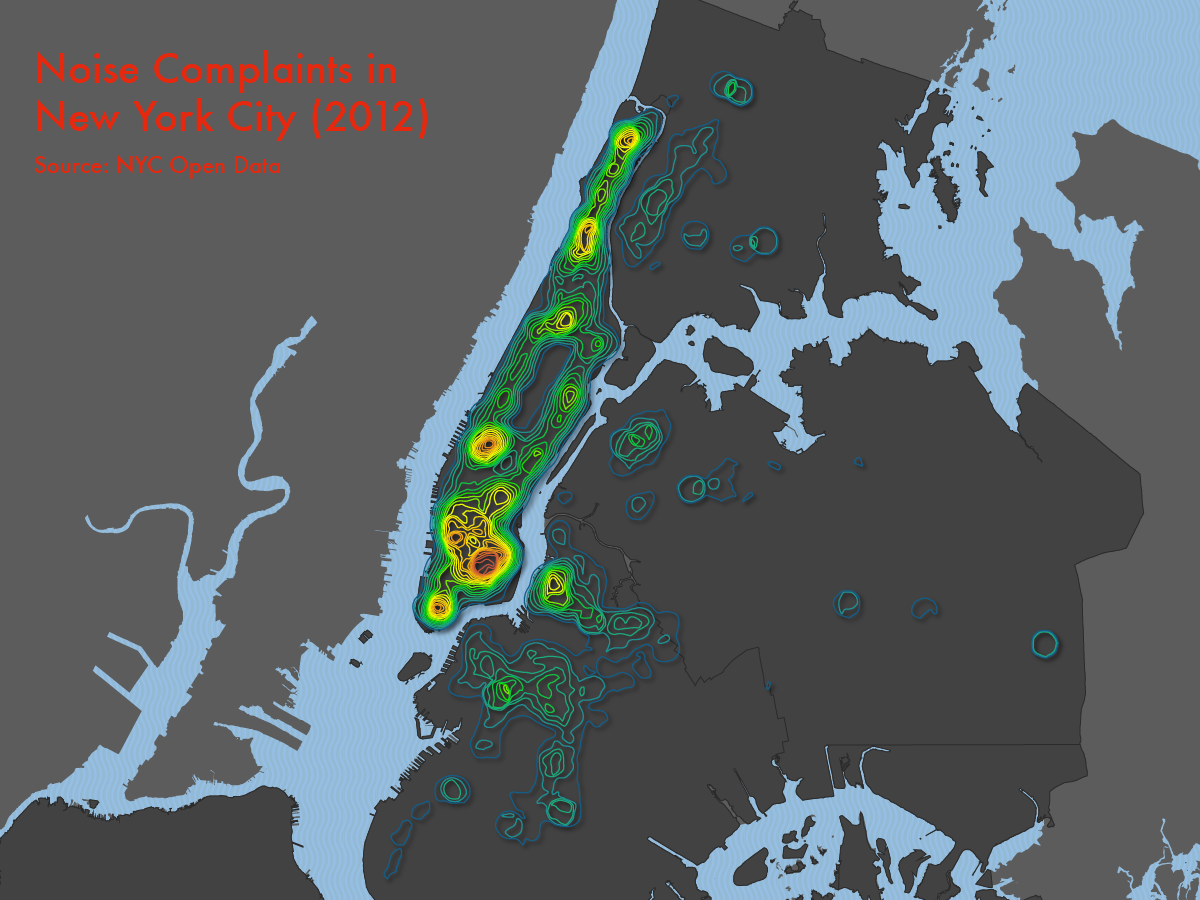
In an effort to familiarize myself with ArcScene, I assembled this three-dimensional contour map of 311 (non-emergency) noise complaints in NYC. I don’t actually recall what the contour values are – again, this was just an experiment – but despite the lack of clarity, one can still identify some interesting patterns in the distribution of noise complaints. I initially intended to export the paths as vectors and edit them in Illustrator, but despite my best efforts, I could only get raster files. So, this is more or less straight out of ArcScene.


