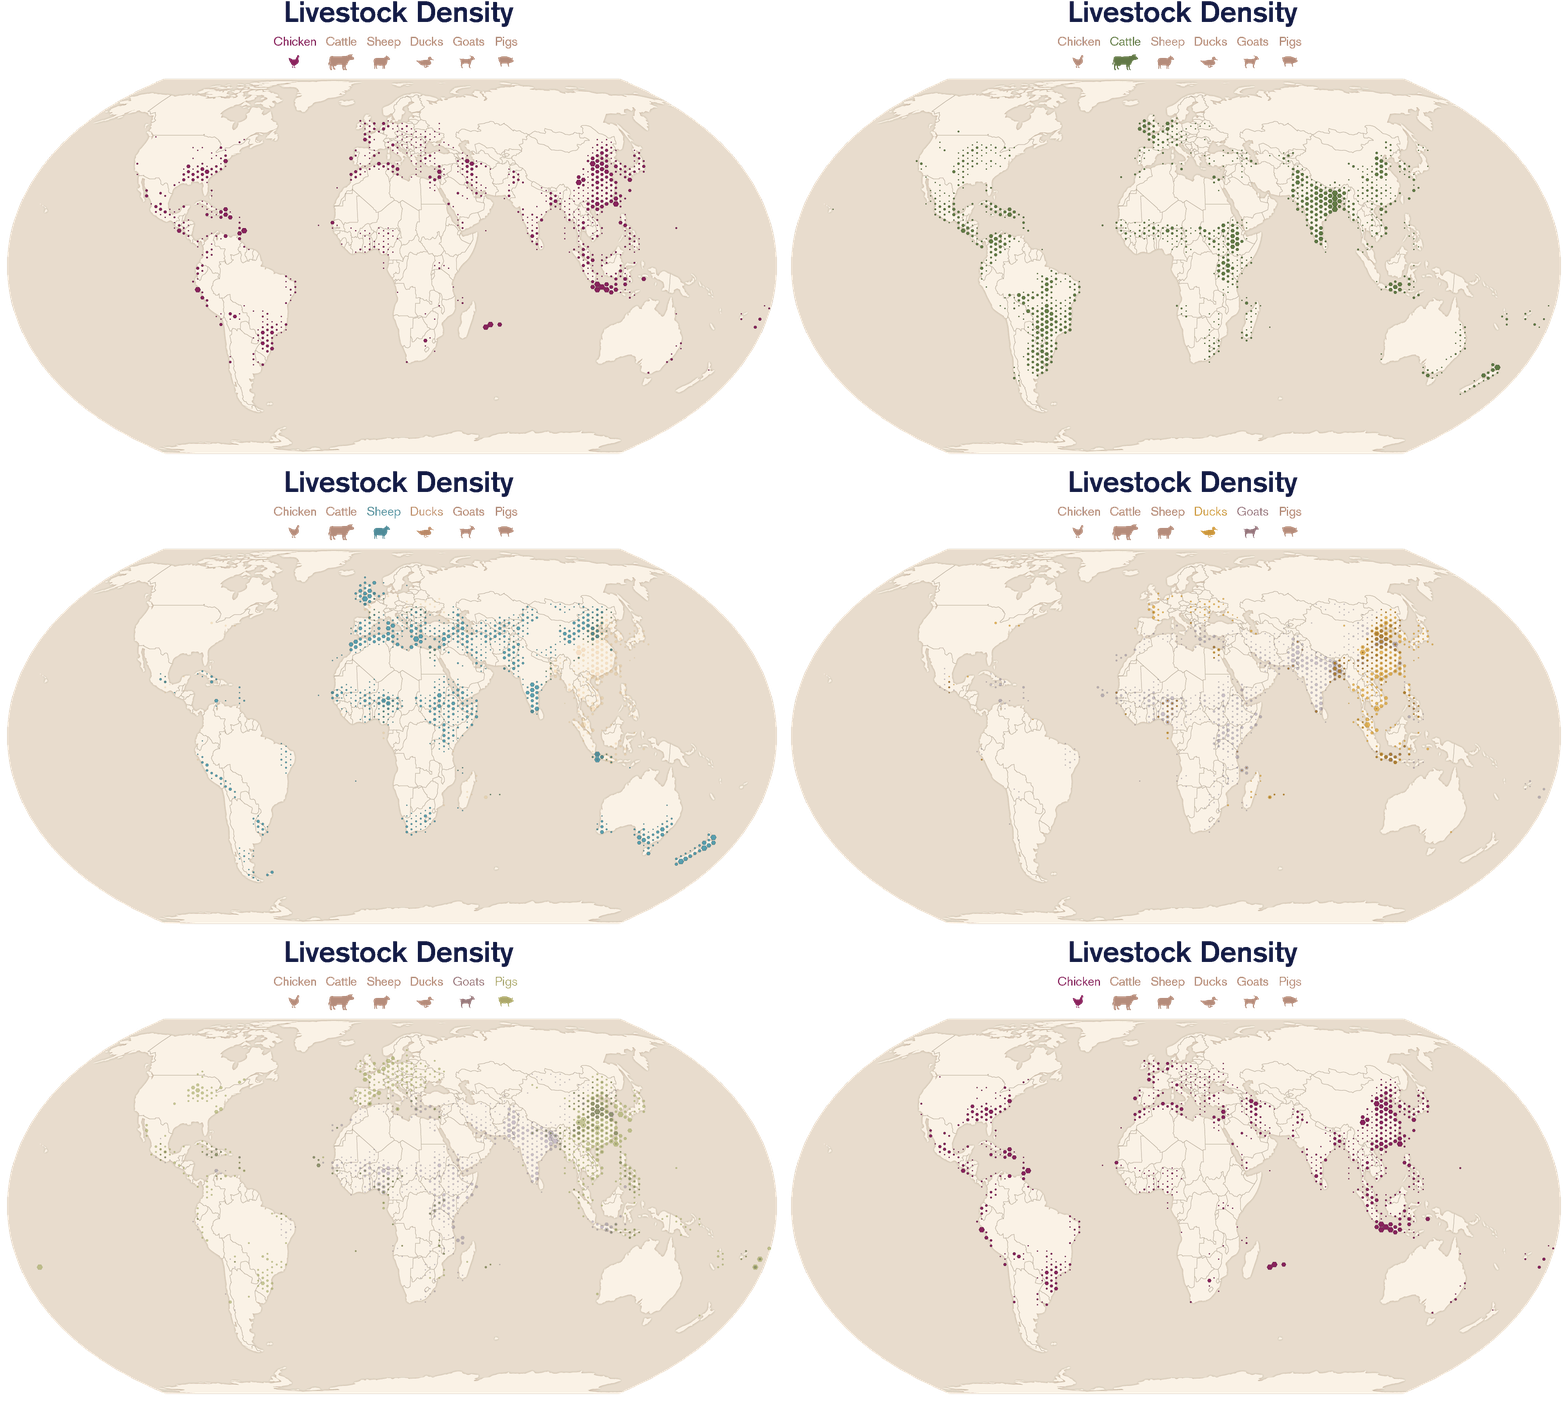
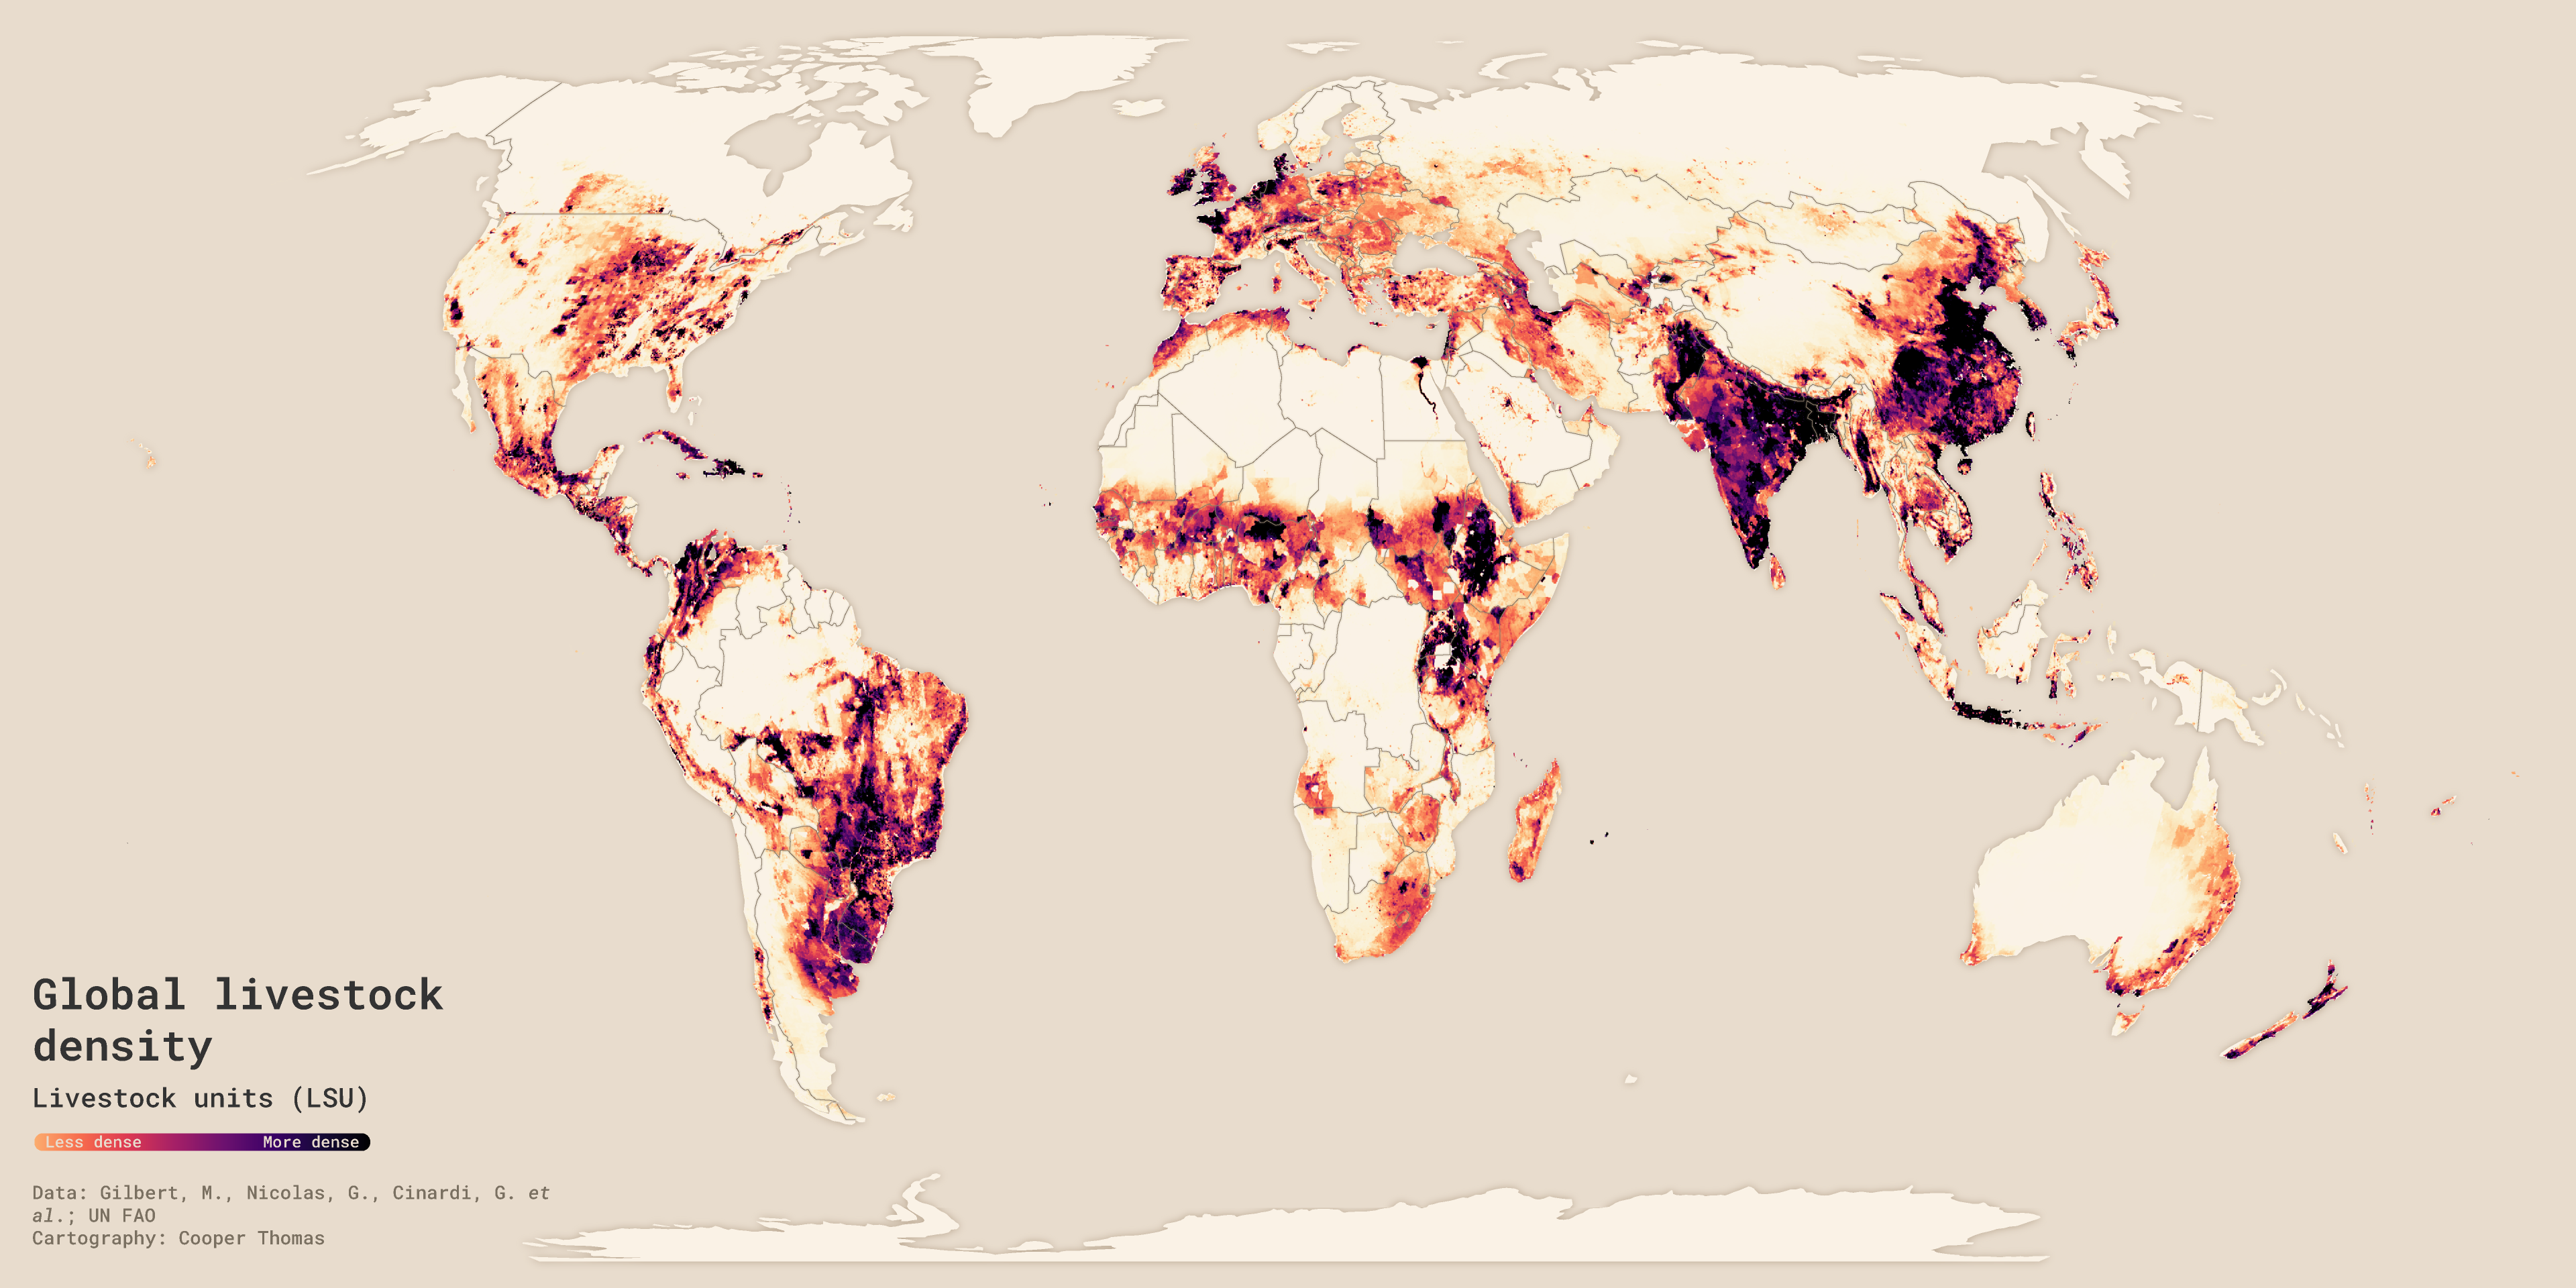
I created this set of livestock density maps for a story map about global livestock production and consumption. The data comes from the Gridded Population of the World (v3), which was published in 2018 but is based on data from 2010. I designed the maps in ArcGIS Pro, and then brought them into Illustrator for layout and cleanup.
In the story, the maps are presented alongside explanatory text, hence the lack of labels or annotations. Here’s a quick GIF combining maps of the six most common livestock types. The livestock icons were designed by Ross Donihue.


