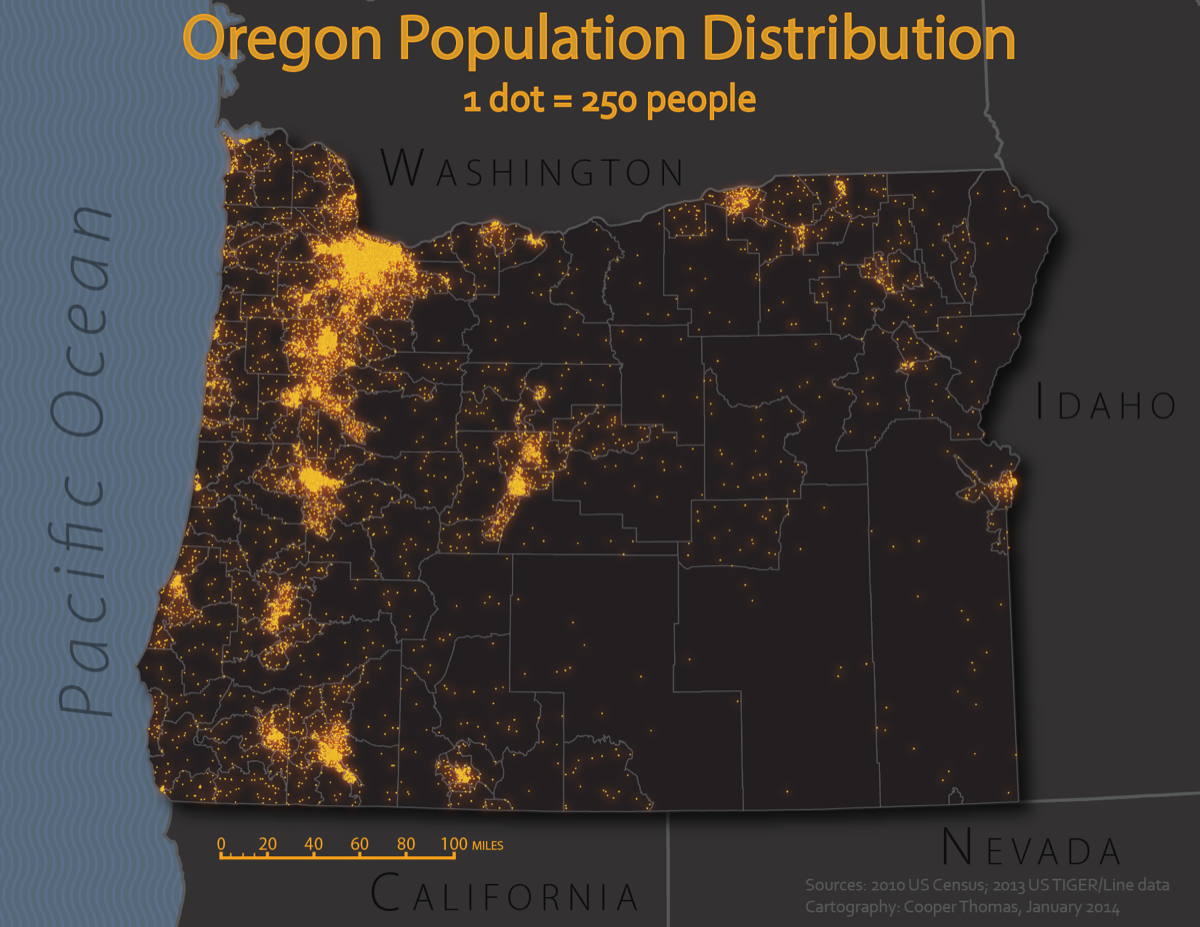
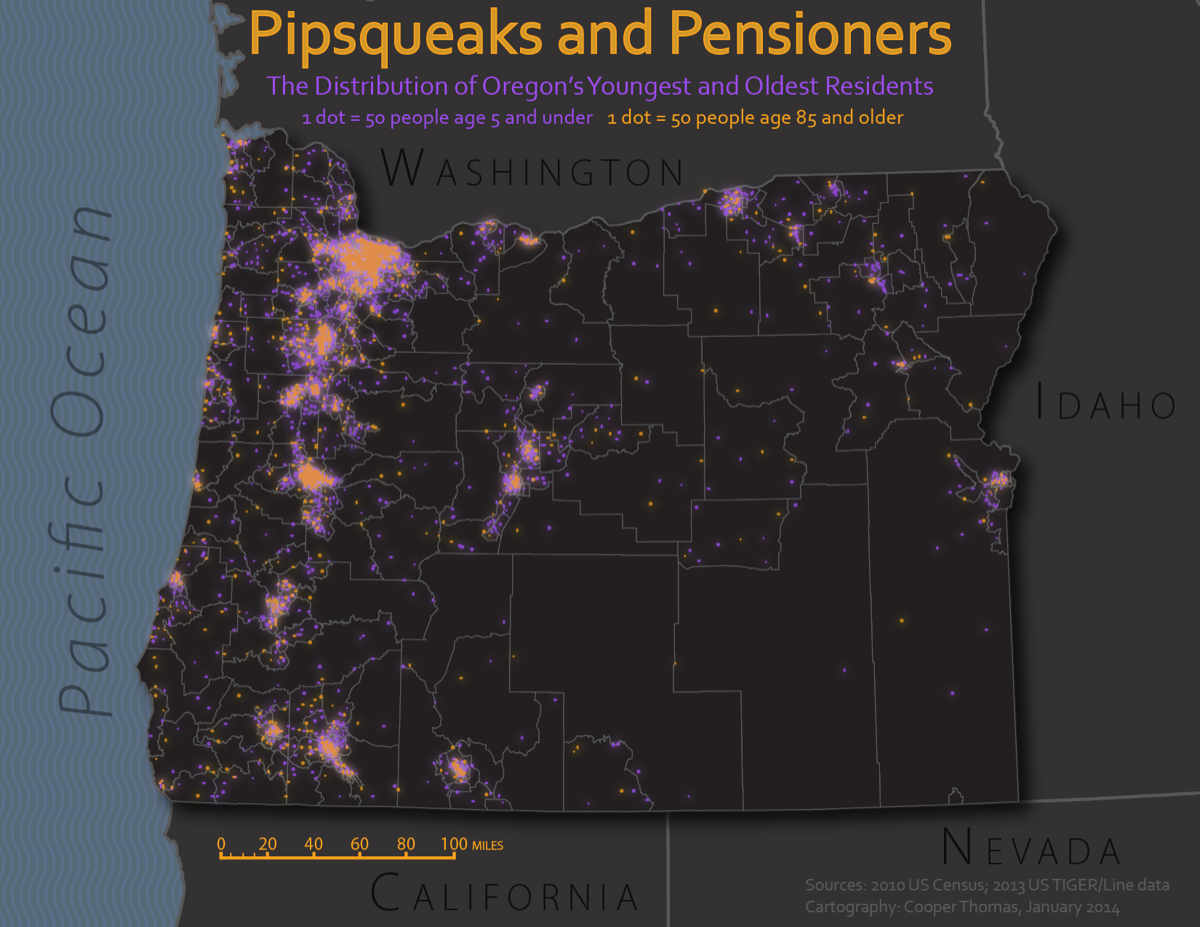
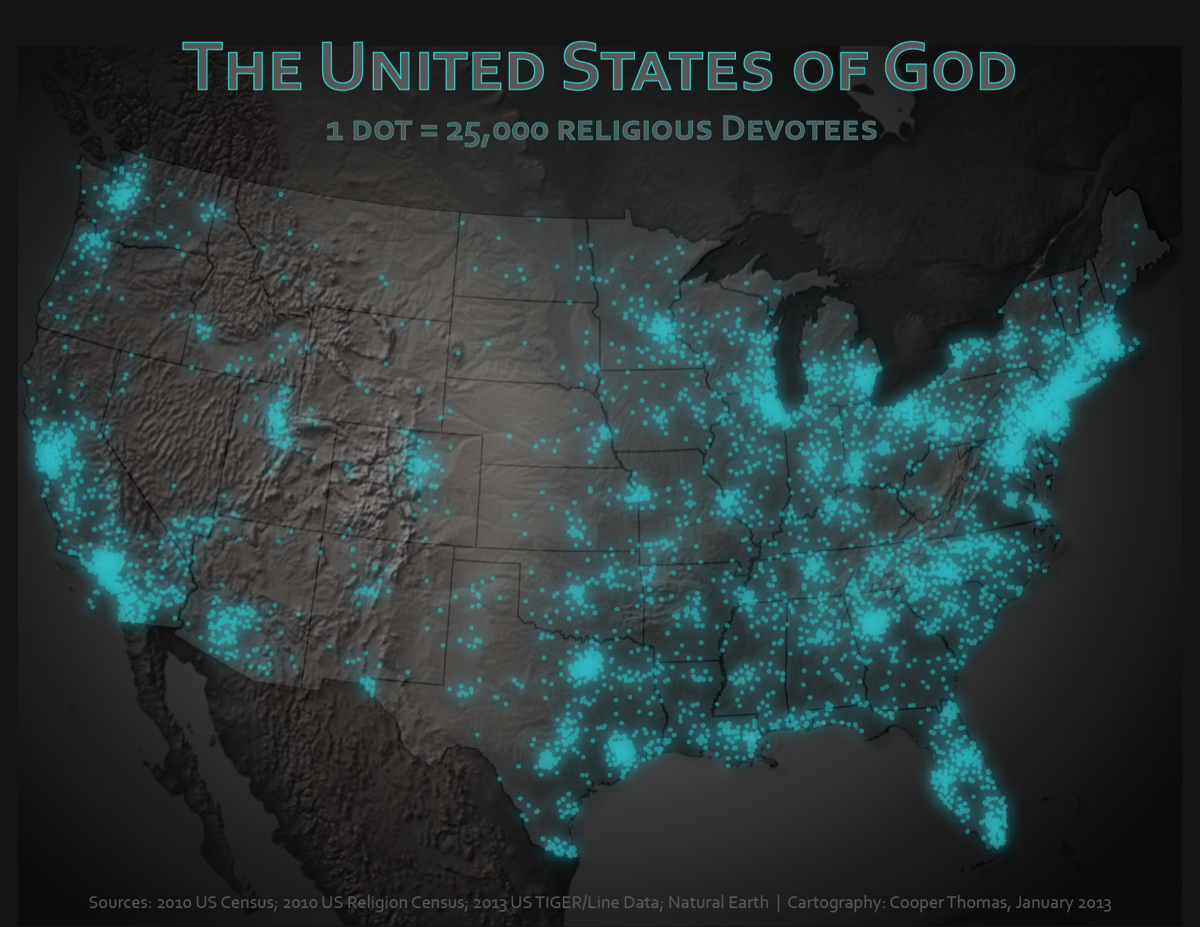
These three maps represent my first real foray into dot density mapping. I used ArcGIS to generate the dots, and then stylized the dots (and other reference layers) in Illustrator. Per John Nelson’s suggestion, I used NASA’s population density imagery as an ancillary masking layer, in order to prevent dots from being drawn in uninhabited areas.
For one, the dots closely mirror the country’s overall population distribution. While this doesn’t necessarily render the data meaningless, it does prevent the viewer from identifying any interesting or meaningful patterns. Also, Oregon’s biggest cities appear to contain many more elderly citizens than juveniles. In fact, the purple (juvenile) dots simply rendered first, and were consequently obscured by the orange dots. This problem can be partially resolved by reducing the opacity or the size of the dots, but both of these options produce other unwanted side effects.
So, while these maps don’t exactly lie to their viewers, they only reveal partial truths. That being said, they were super fun to produce, and are fun to look at, and so I’ll go ahead chalk this project up to a partially successful work-in-progress.


