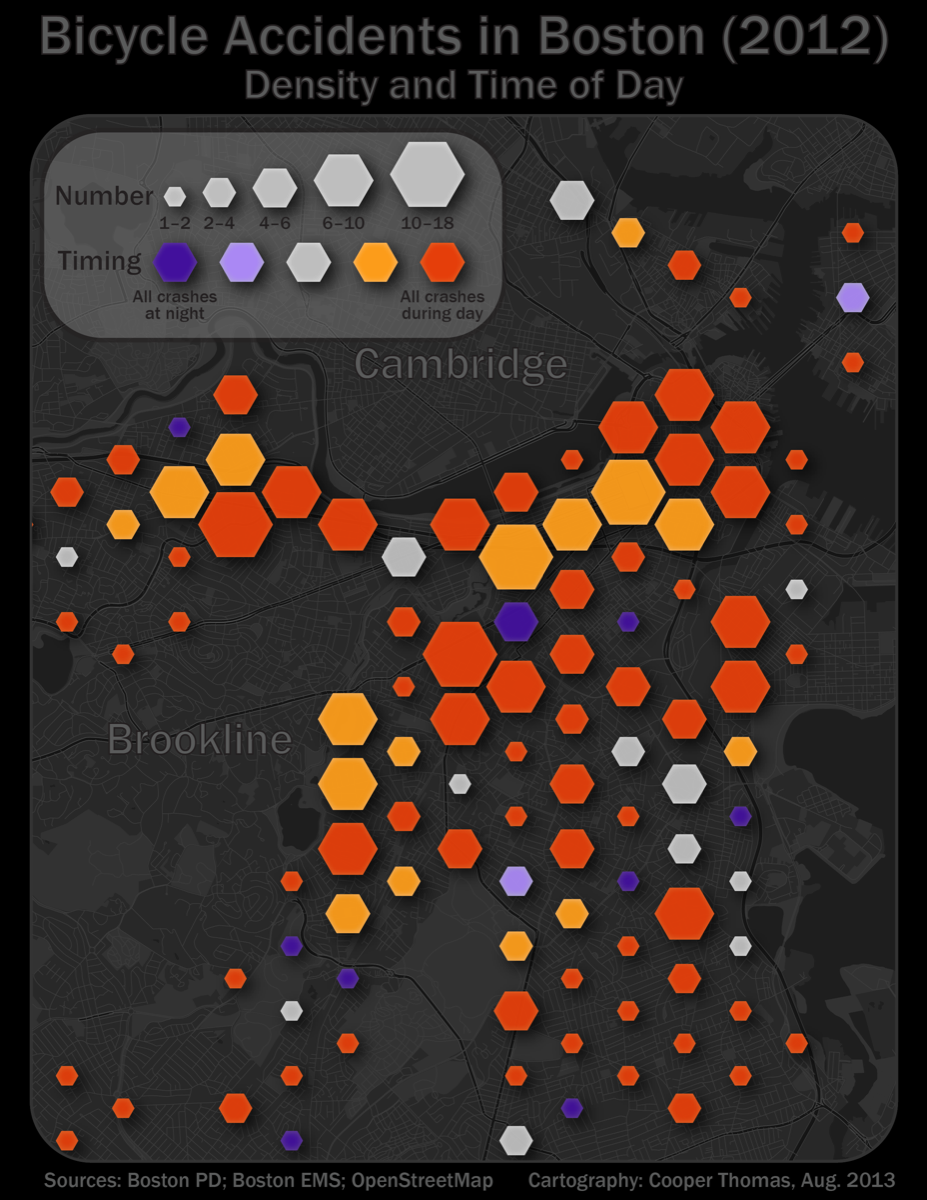
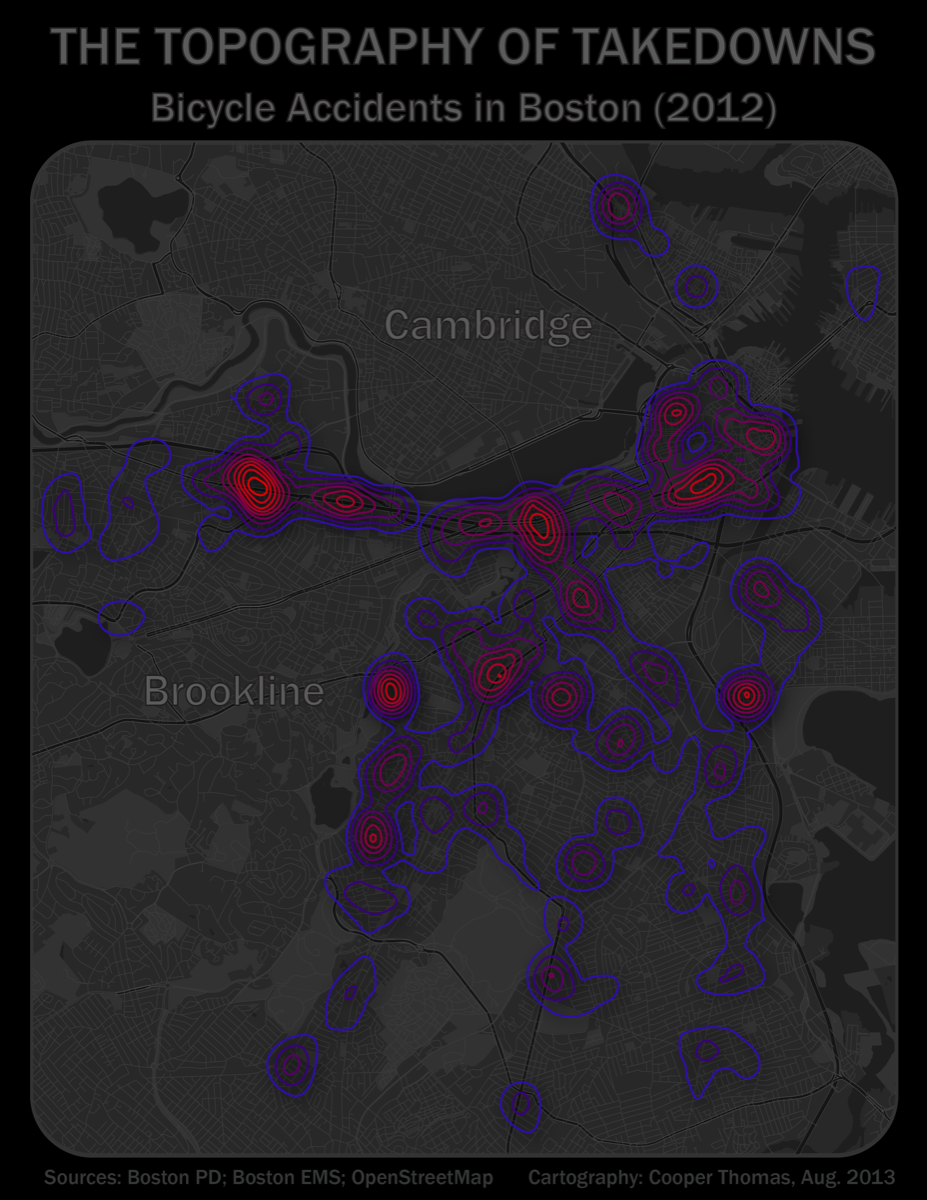
Some of you may have previously seen my DC crime maps, in which I use contour lines and hexbins to visually identify the most violent and crime-prone areas of the city. Here, I’ve applied those same visualization techniques to a completely different set of dense point data: bicycle crashes in Boston.
The contours in the first map cast a simplified geographic picture of bicycle accidents across the city. Incidentally, most of the crash hotspots align with highway entrances/exits (e.g., the Cambridge St. crossing of I-90 in the northwest quadrant of the map), busy and poorly marked intersections (the Commonwealth Ave./Massachusetts Ave. intersection in the center of the map), or surface-level public transit corridors (the MBTA green line Huntington Ave. corridor, immediately east of the ‘Brookline’ label). Interestingly, this map illuminates the relative safety of the Boston Common, and more importantly, the relative danger of biking in the streets surrounding the park. This salient spatial relationship has interesting political implications, as the Boston municipal government recently redoubled its efforts to keep cyclists out of the Common. Assuming the trends on this map hold true in 2014, the exclusion of cyclists from the Common will only increase accidents in the immediate vicinity of the park. Ruh roh!
The second map uses hexbins to simultaneously visualize bicycle crash densities and crash timing. While this map doesn’t reveal any major accident anomalies, it does illuminate (har har har) the perils of the poorly lit Huntington Ave./Massachusetts Ave. intersection; here, all five bicycle accidents in 2012 occurred after sundown. Don’t forget your bike lights, folks!
*Update (1 November 2013): After receiving some particularly vitriolic fanmail, I’ve updated the title of the first map from “The Topography of Tumbles” to “The Topography of Takedowns.” Yeah, take that, drivers!


