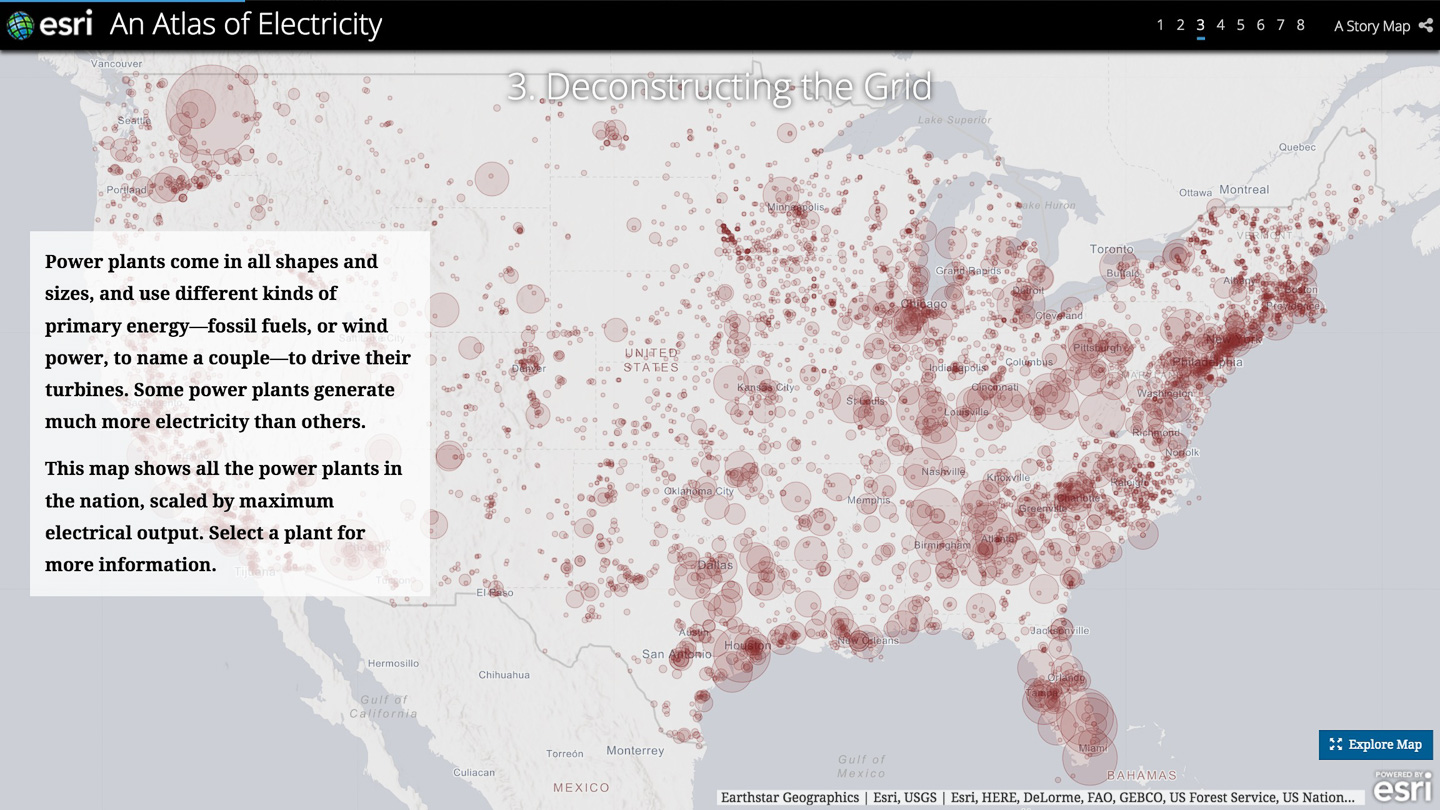
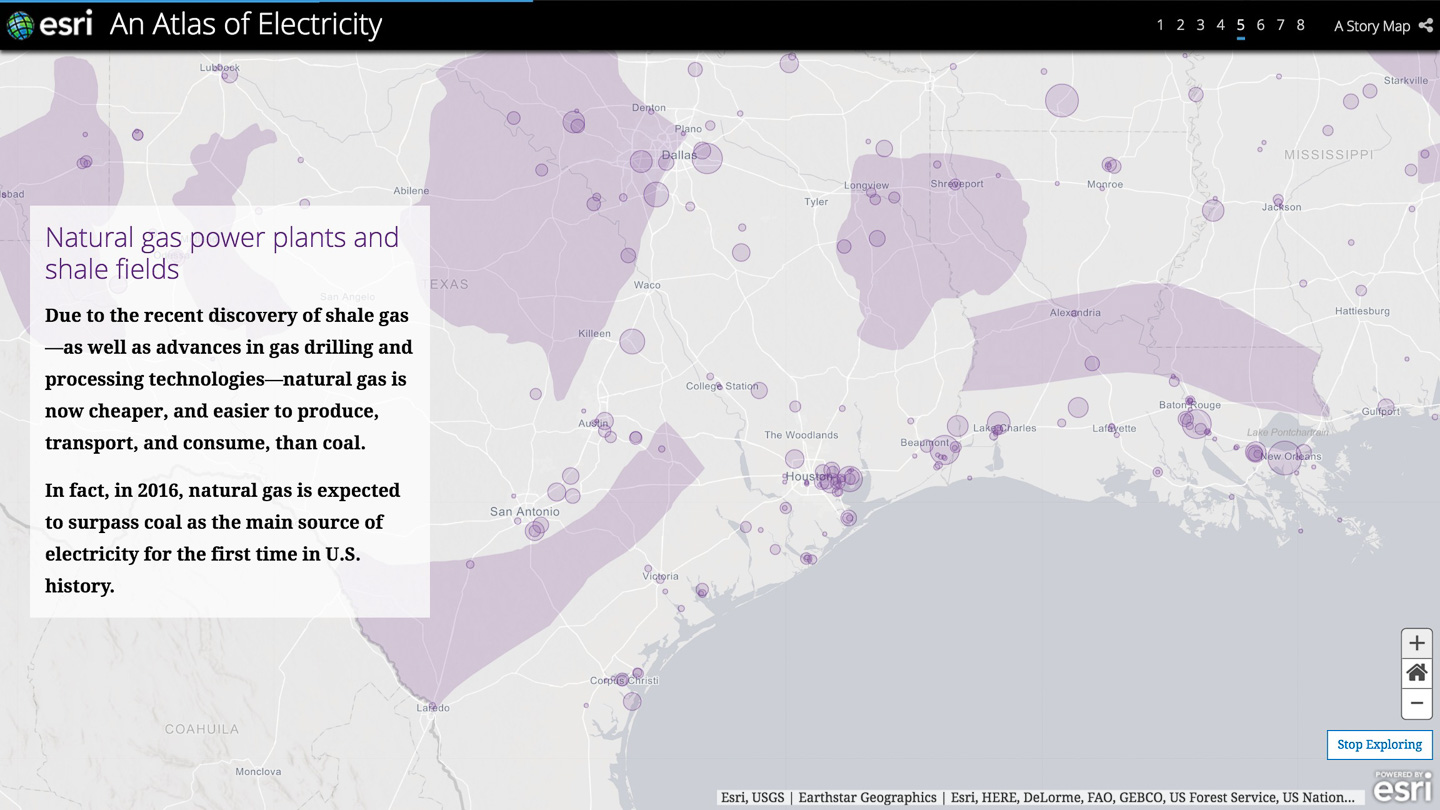
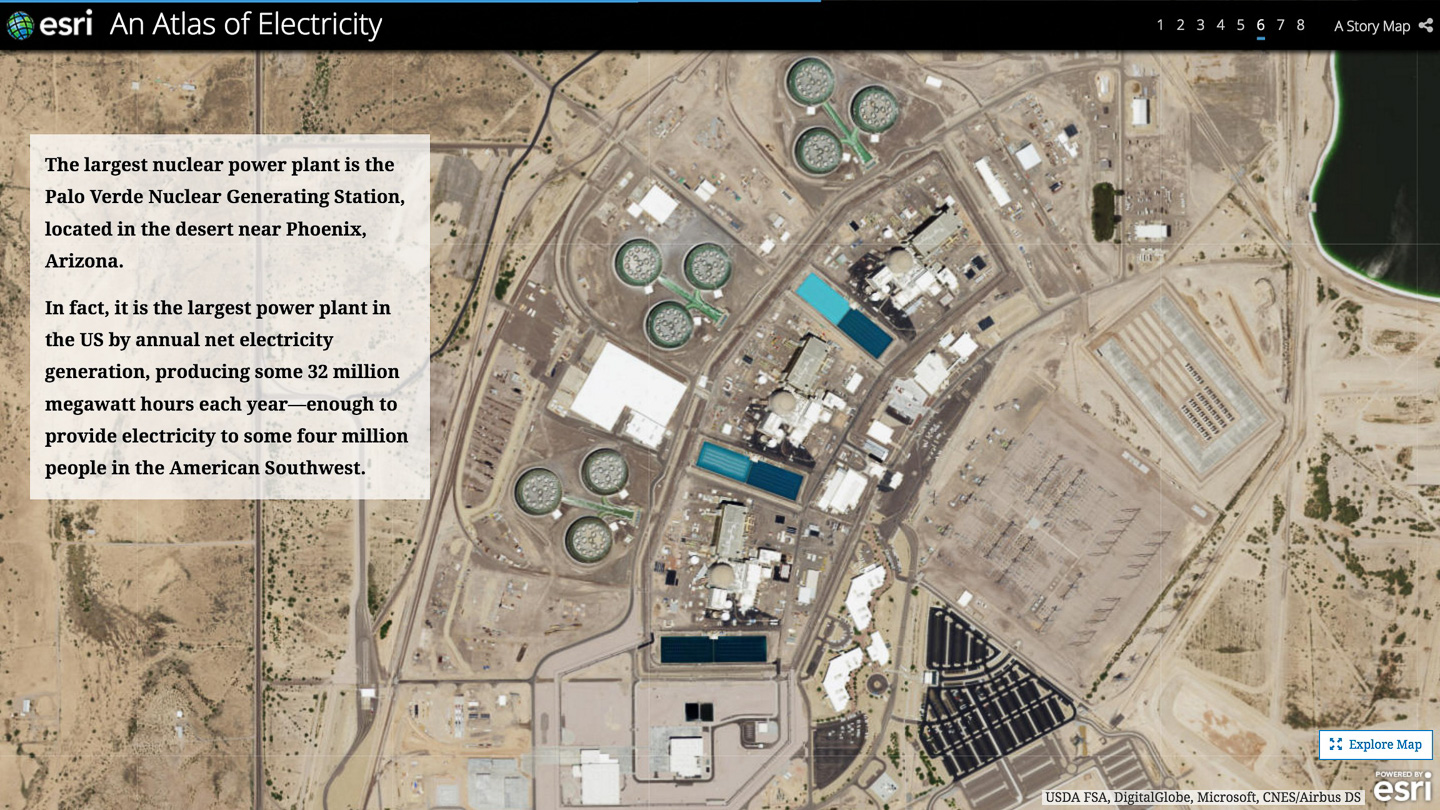
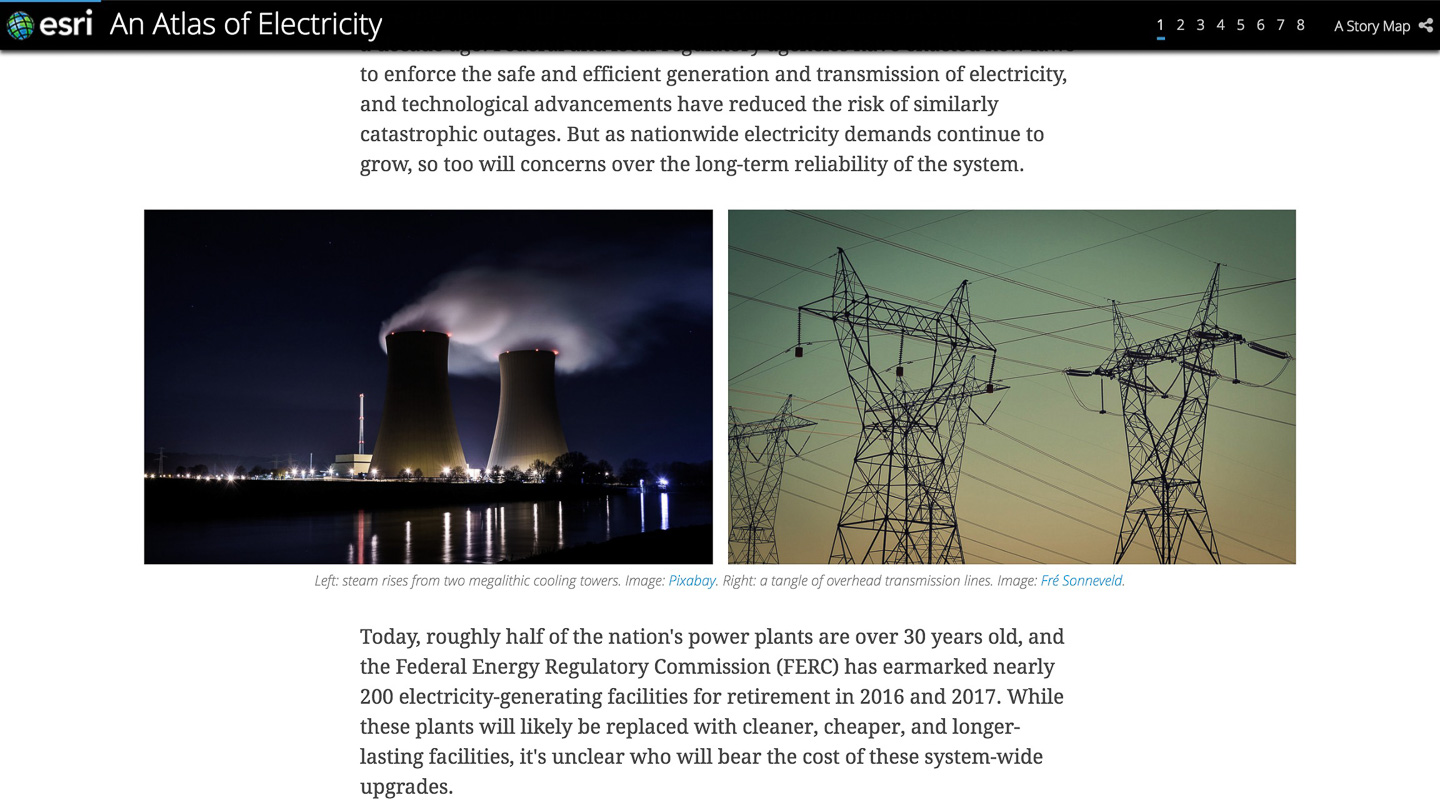
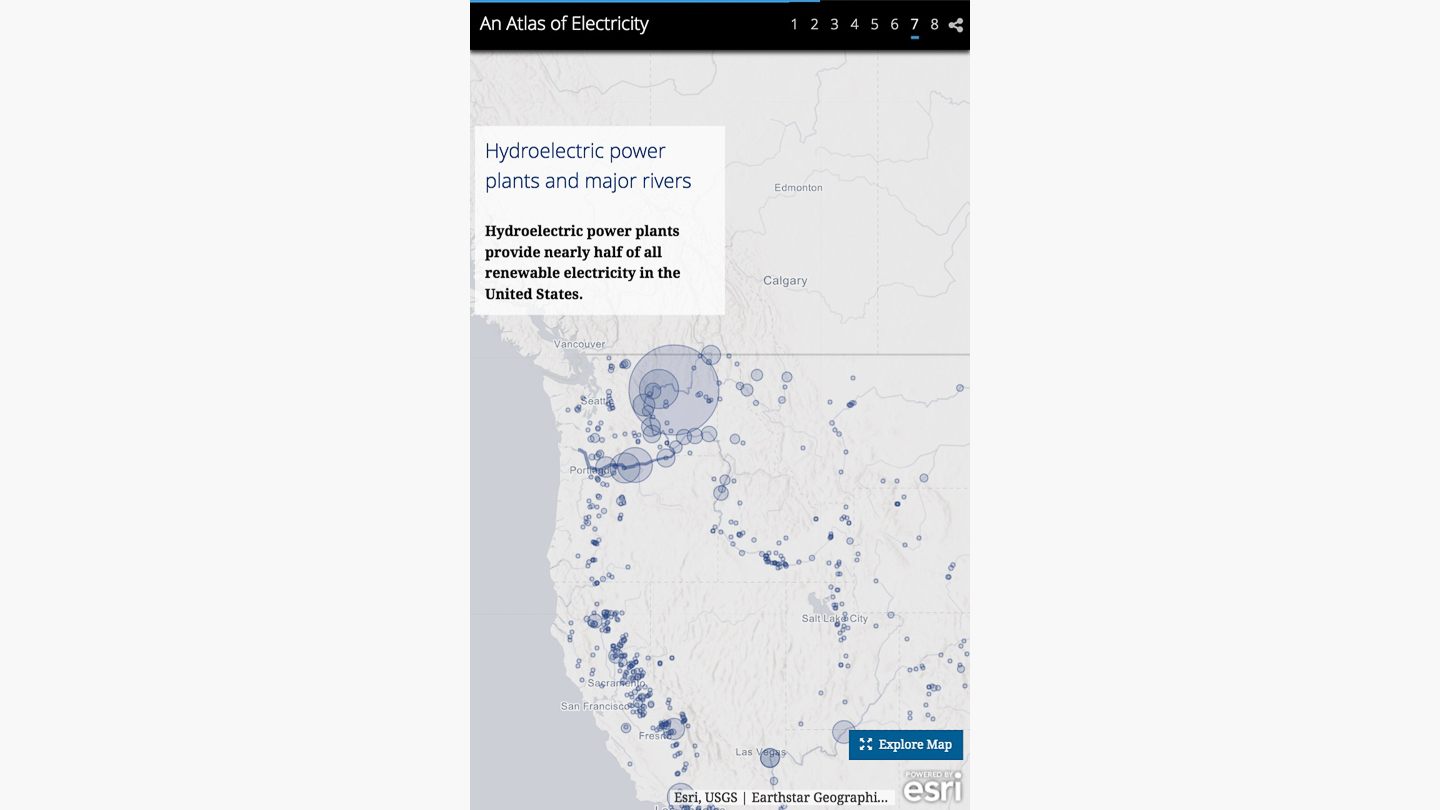
One of the coolest things about working on the Story Maps team is that I am allowed, and even encouraged, to explore topics of personal interest. One such example is this Atlas of Electricity, a multimedia piece that examines all aspects of the American power grid. The idea for this map came to me a couple months ago, during a brief conversation with my erstwhile roommate about our electricity bill, which seemed unreasonably high to me. As an economist at FERC (the Federal Energy Regulatory Commission, which oversees the sale and transmission of electricity), he quickly filled me in on some of the political and infrastructural complexities of the American power grid, and how these impact end users.
This conversation left me with more questions than answers. So, I set about researching various aspects of the power grid—specifically, the generation, transmission, distribution of electricity—and began to compile and visualize relevant data, mostly just to satiate my own curiosity. I eventually showed a few of the maps to my colleagues, and they also found it compelling, and so I decided to consolidate all these disjointed fragments into a cohesive Story Map. The Atlas of Electricity is the result of those efforts.
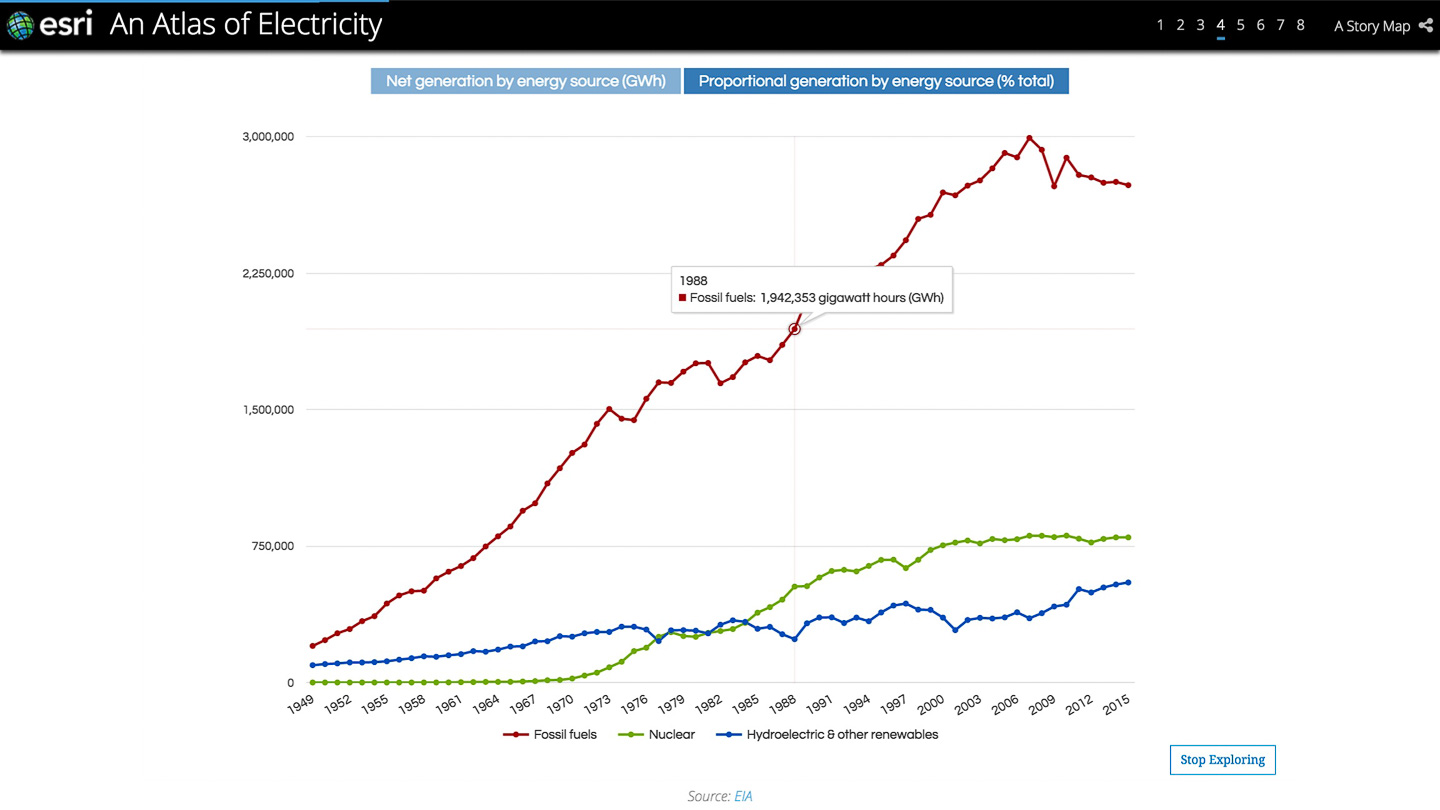
The Atlas is not intended as an exhaustive overview of the American power grid, but rather, a (hopefully) engaging primer on electricity in the U.S. It’s also probably a little unbiased, since its original incarnation was just kind of a visual journal. (There’s a disclaimer in the credits section, don’t worry.) The basemap is a bespoke ArcGIS Online vector tile layer (which you can find here), set to 20% transparency and draped over the Esri World Hillshade layer (here) and the interactive charts were created using the Google Charts API.

