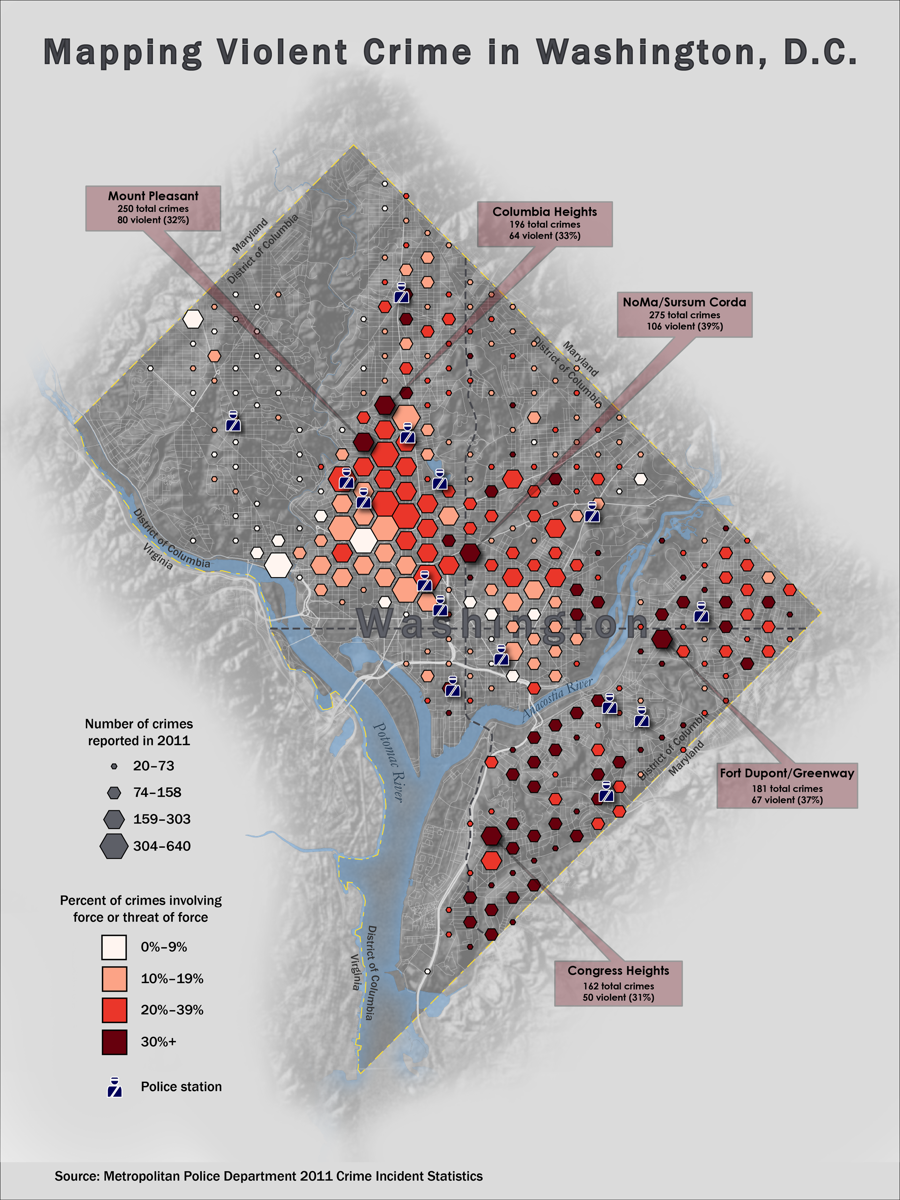
The process of “binning,” or grouping nearby data points into discrete equal-area polygons, is a great way to visualize spatially concentrated vector point data. Binning is especially useful for multivariate mapping, because all bins are the same shape and size, and can thus be scaled in proportion to an attribute without misrepresenting the data or confusing the viewer. (Contrarily, if you wished to scale census tracts in proportion to an attribute, the results would be cool-looking but not particularly enlightening, because census blocks are not normalized by area. This is the chief problem with cartograms.) By using proportional, choropleth, and value-by-alpha (i.e., transparency) symbolization schemes in conjunction with bins, one can effectively visualize at least three attributes on a single map.
Of course, binning, like most mapping methods, has some drawbacks. For one, the bins’ placement is determined by the size of their grid cells, rather than by actual map features. This poses serious problems for “naming” the bins. On this map, for example, each neighborhood contains multiple bins, and some bins straddle multiple neighborhoods; consequently, there’s no easy way to identify the bins, short of implementing a grid-based naming system (e.g., A1, B4, F6, etc.) which is pretty unwieldy. Also, binning necessarily reduces the spatial resolution of the data. That said, binning illuminates patterns in densely concentrated point data far more effectively than other methods, and as mentioned above, is well suited for multivariate mapping.
About this map: crime data is relatively easy to visualize – if not always understand – because it occurs quite frequently, and is typically well documented. I created this map because a) I wanted to experiment with GDAL and digital elevation models, and b) I dreamed I was a hexagon. And DC’s expansive data repository is always a solid source of GIS data. People tend to equate crime with danger, and yet, most crimes committed do not involve force (or even the threat of force). By visualizing total crime counts and violent crime percentages simultaneously, this map attempts to dispel the commonly held perception that crime is invariably life-threatening. Make no mistake: I am not trying to downplay the significance of breaking the law. However, as this map indicates, areas with higher crime rates are not necessarily more dangerous than areas with lower crime rates.
In order to pare down the vector dataset so that my poor, overworked laptop could process it without spontaneously combusting, I removed any bins wherein fewer than 20 crimes were committed. This deliberate omission is, admittedly, a bit of a statistical no-no, but given that this project began as more of an artistic experimentation than a rigorous geospatial analysis, perhaps you’ll overlook this detail (as I did). Also, I generated the hexagonal lattice in my output projection, so that the hexes remained equilinear. The two attributes were classified using a four-class natural breaks scheme. Each unscaled hexbin occupied approximately 310,000 square meters – that’s roughly 31 hectares, 0.12 square miles, or 2.4 million 16-inch pizzas.
BONUS:
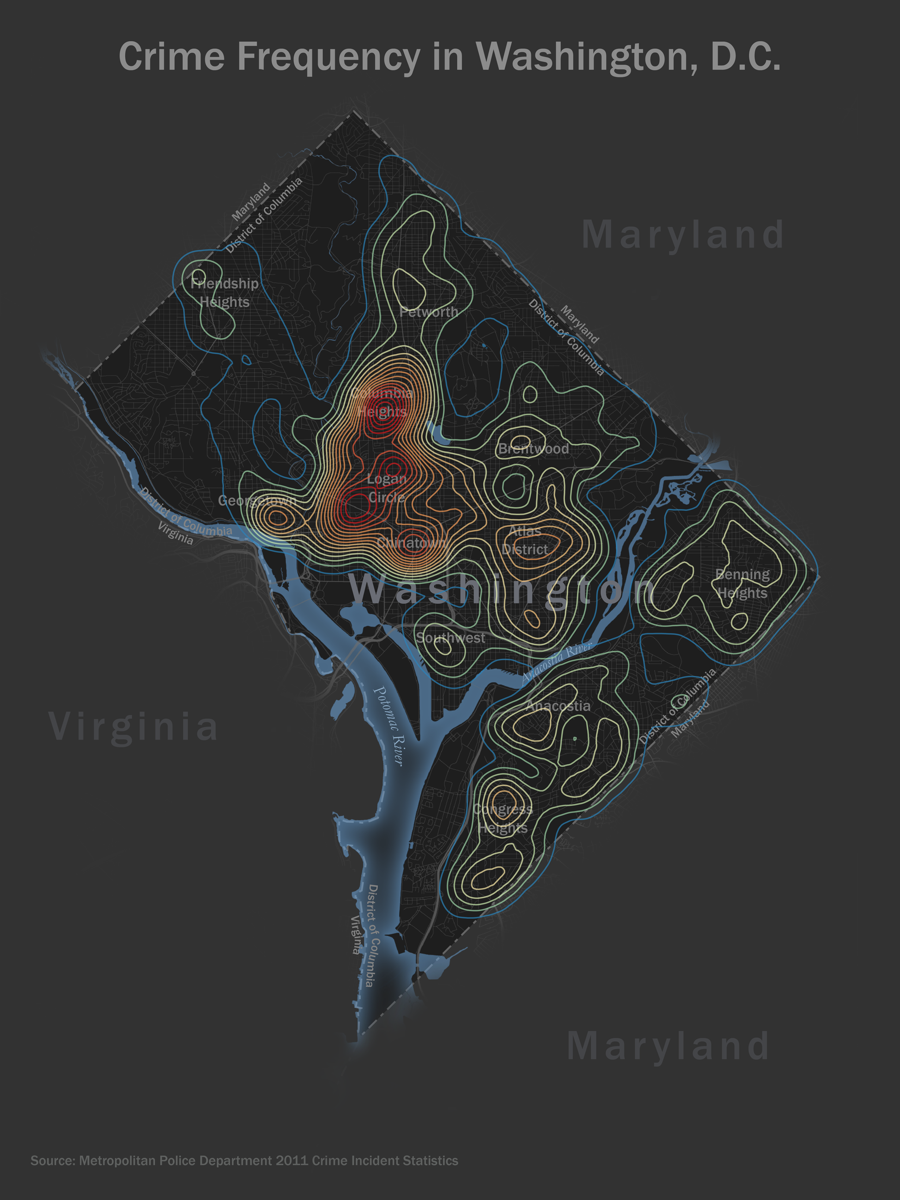
The second map uses contour lines to show variation in overall crime frequency across the city. This map is more or less a static version of Chris Herwig’s map of New York “stop-and-frisk encounters, but I think it complements the hexbin map quite nicely. I know that my map suffers from the “island effect,” and lacks a scale bar and a north arrow, but most viewers will presumably be familiar with the area.


